Test NanoTrader Full I Test Tradingview I Test the mobile platforms All for CFD-Forex & Futures
You are here
The secret king of chart patterns: The Wolfe Wave

The Wolfe Wave - With aesthetics to profit. Chart patterns can already consist of individual candlesticks. Trading them is a worthwhile strategy, as they appear purely visually on a chart, independent of indicators or the fundamental environment. However, it is difficult to capitalise on them in the long term, as they often turn out to be a failure. A good risk-reward ratio and a solid hit rate are therefore necessary for pattern trading. A pattern that combines these two criteria and can also be defined very precisely is the so-called Wolfe Wave. Even though its occurrence is not exactly frequent, it promises excellent trades time and again. Source: Traders' Mag.
The Wolfe Wave
Definition and origin of the Wolfe Wave
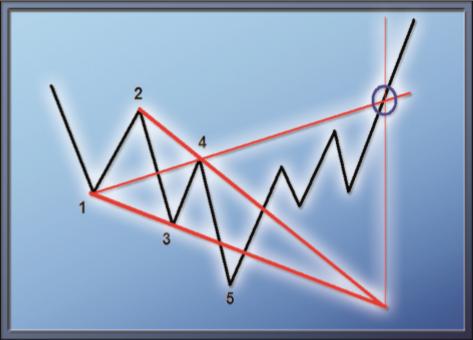
Figure 1 shows the Wolfe Wave in its theory. This may appear somewhat confusing at first glance, but it follows a fixed systematic. Points 1 and 3 mark relative lows, points 2 and 4 relative highs in the chart. In a bullish Wolfe Wave, it is important that the high in point 4 is below the high in point 2 and the low in point 3 is lower than that in point 1. If these four points are pronounced, they can each be connected by lines. Now it depends on what the further course is like. According to the definition, point 5 is another low that usually occurs below the line drawn from 1 to 3. From there, however, a trend reversal takes place, the movement of which should be traded successfully. Figure 1 shows a bullish Wolfe Wave. The Wolfe Wave also works in reverse - as a bearish pattern.
Figure 1: The Wolfe Wave. The Wolfe Wave consists of five points and three lines, whereby the lines also serve to determine the price target. A stop is optimally located at point 5.
Setting the profit target
There are two ways to determine the profit target. One is based on the exact price and is obtained from the line between points 1 and 4. As soon as the rally that starts after point 5 crosses this line, the favoured selling price is reached. The second variant works completely differently. This is based on time. Accordingly, the selling point is reached when the chart is at the level of the intersection of the two original lines. In the example illustration in Figure 1, these two points ideally coincide. In reality, however, this is rather the exception and therefore one should agree in advance on one of the two variants or proceed according to which of the two suggests the exit first.
Stop loss and Return/Risk ratio (RRR)
From this point of view, the Wolfe Wave becomes particularly attractive. If the low in point 5 has been established, point 5 is again an excellent stop. Since it is often difficult to precisely identify a low, the re-break of the 1-3 line can also be used as an entry signal. Even then, the relationship between entry, stop and target price, as long as it is determined by the 1-4 line, offers a first-class risk-reward ratio. In this way, all criteria for recognising and trading the Wolfe Wave are established. (Read more about the important Return/Risk Ratio concept in trading).
FREE e-books for you...
Five points and three lines
As a Wolfe Wave Trader, you can sit back and relax. For the time being, "spotting" only refers to counting the highs and lows. Once the points 1, 2, 3 and 4 have been identified and the lines drawn, one observes the further course and, if possible, finds a favourable point 5. If this signals the entry by crossing the 1-3 line, the position is opened. Target and stop are now fixed. Wolfe waves can occur on any chart, regardless of the time frame and the value under consideration, and are by their nature particularly suitable for top and bottom picking.
A trade example - Ladbrokes Plc.
FTSE stock Ladbrokes (Figure 2) formed a somewhat crippled but still meeting all criteria bullish Wolfe Wave in July this year. After the high in point 2 was a bit of a wait, it was quickly followed by points 3, 4 and 5. Fortunately, the low on the day after point 5 did not extend far enough to stop out the trade.
Figure 2. Ladbrokes Plc, daily chart. This chart shows a bullish Wolfe Wave in combination with the Relative Strength Index. Its divergence (blue line) serves as a filter.
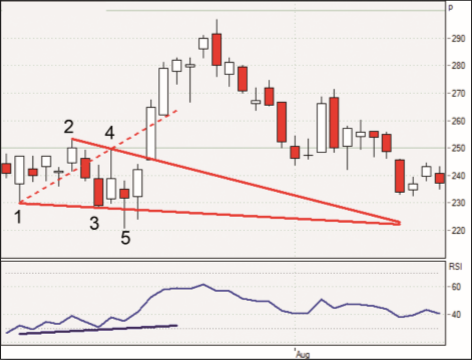
Shortly afterwards, the price target was already reached. If one had waited the long time for the time target, the trade would have turned out much worse. This is an indication to always opt for the price target that occurs first, unless the stop has taken effect beforehand. Assuming the trade was taken at the intersection with the 1-3 line, the figures are as follows. Entry at 227.34, stop at 220.75 and target at around 258.00. So 6.59 was risked to gain 30.66. This corresponds to a great risk-reward ratio of about 4.6.
Furthermore, you can see the Relative Strength Index (RSI) in Figure 2, which can be used as an additional filter for bottom-picking projects. The simple rule: If the chart forms a new low which is not apparent in the RSI, the low is to be classified as weak, which indicates a possible trend reversal. This phenomenon is called a divergence. The RSI is an excellent filter in combination with Wolfe Waves.
The bearisch Wolfe Wave
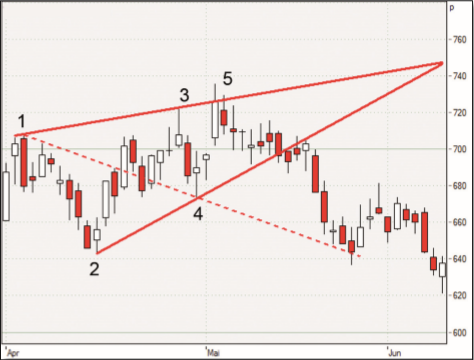
In April and May of this year, another FTSE stock, Prudential, experienced a bearish Wolfe Wave of somewhat nicer shape (Figure 3). As you can see, the price target (dashed 1-4 line) was optimally achieved. The time target would have yielded a little more, but again was not due until later.
Here, too, the narrow crossing of the 1-3 line by point 5 offers first-class risk-reward figures: Entry at 726.00, stop at 736.00 - risk therefore 10.00. The target was reached at approx. 642.00. This would have led to a profit of 82.00. In relation to each other, this would result in a risk-reward ratio of 8.2. For comparison: If this trade had only been successful one out of eight times, it would still have been worthwhile. Experience shows, however, that the hit rate for an average trade is much higher than 12.5 percent.
Figure 3. Prudential, daily chart. Here you see a bearish Wolfe Wave. Almost two months pass from point 1 to the price target
The lucky Wolfe Wave
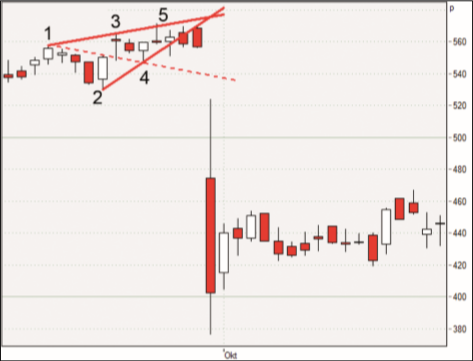
Figure 4 illustrates another example of a bearish Wolfe Wave, spotted at the end of September 2007 at Tate & Lyle Plc. It was pronounced according to all criteria and the trade could be entered at a very close point 5. However, a cut with the 1-4 line never occurred, as there is a large gap in the chart at this point. In this case, it would have been possible to close the gap with the opening price. Furthermore, this day coincides exactly with the target price. In this case, the trader could have been happy about an additional profit, but the example shows impressively that such price gaps can theoretically also occur against an open position. This can lead to unplanned losses. Therefore, always make sure that you have your risk under control. A per-trade risk of more than three percent of the total account size is negligent and can no longer be called serious trading.
Figure 4: Tate & Lyle Plc, daily chart. The price gap favoured the trade and even increased the profit. At the same time, it coincides with the time target, the intersection of the 1-3 and 2-4 lines.
Conclusion
The Wolfe Wave can easily be called the secret king of chart patterns. Many criteria are necessary for its formation, but they harmonise excellently with each other. Once the five points and three lines have been discovered, one can look forward to a trade with a good risk-reward ratio and precisely defined stop and target. Wolfe Waves can be described as a top- or bottom-picking approach and can thus also be well integrated into an already existing top- or bottom-picking strategy.
If you want to improve the quality of the individual trades even further, it is advisable to use the relative strength index as a filter. Wolfe Waves can occur on any chart, but success is likely to be somewhat better on daily charts, as the trend occurring there is usually somewhat more intense than intraday movements. Be creative!
If you are interested in a good managed account, check out this regulated service...
People also read
- Know your Return Risk Ratio (RRR)
- The (new) Hikkake chart pattern for traders
- Trading based on the Parabolic SAR indicator
"If you can't explain it simply, you don't understand it well enough."
- Albert Einstein
Free demo

Trading videos
Charting, strategies, automated trading, backtesting, playback... watch these videos and become a platform master.

Broker
WH SelfInvest serves traders from offices in Germany, France, Switzerland, Belgium, Luxemburg and the Netherlands.
The spectacular SignalRadar
SignalRadar shows live trades being executed by various trading strategies.
More ...
- ‹ previous
- 2 of 5
- next ›