Test NanoTrader Full I Test Tradingview I Test the mobile platforms All for CFD-Forex & Futures
You are here
Trading based on the Parabolic SAR indicator
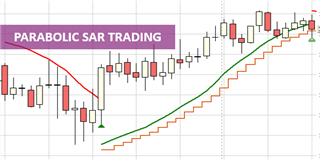
Among the technical indicators belonging to the category 'curves', the Parabolic indicator is one of the most aesthetic, due to the beauty of its line. But... it is also one of the most practical indicators, since it can combine three functions: trading signal, trend filter and trailing stop. No matter how experienced you are in trading, you can't help but be seduced by its effectiveness. In this article, we look at a day trading strategy for he Dow Jones market index. The strategy uses the Parabolic indicator as a trading signal and a trailing stop.
The Parabolic Indicator
This indicator is presented as a system with two curves: one red and one green. In the following example, the red curve of the Parabolic is located above the price, and the price is trending down. At some point, the price bounces up. When the price closes above the red curve, the downward movement is considered to be over and a bullish movement begins. During a bullish move, the green curve is below the price. The term parabolic comes from the resemblance of the shape of the price curve to a parabola, especially when there is a trend.
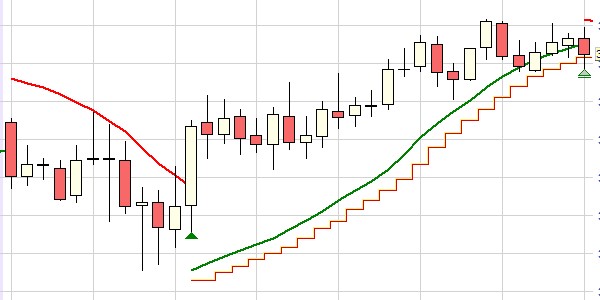
This example illustrates the three functions of the Parabolic indicator: Firstly, as a bullish signal, identifiable by a green triangle and generated when the closing price crosses above the red curve. Secondly, as a trend detector. Indeed, as long as the price does not cross the curve, the market trend continues. Thirdly, as a trailing stop, as in this case where the red stop trails the green curve at a given distance.
How to trade the Dow Jones market index
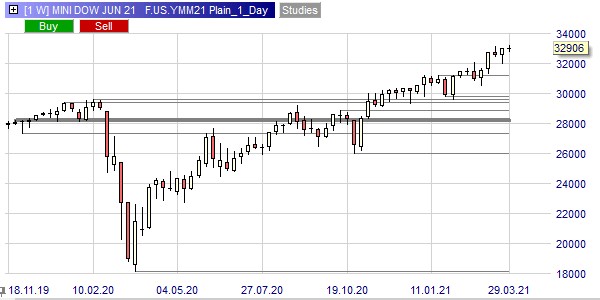
The signals created by the Parabolic indicator are effective in capturing bounces. In general, this type of signal is all the more effective if it is associated with a trend filter. In the case of the Dow Jones, we can simplify our lives insofar as this market has clearly been in an upward trend for several months. All we have to do is accept only the long signals. To see this, we display a weekly chart of the Mini Dow future loaded with the SNIPER indicator. This indicator draws the major support/resistance lines. We can see that the bullish rebound that started at the end of March 2020 resumed its course at the end of October 2020 after the US presidential election. Since then, the Mini Dow has been in an uptrend after breaking its February 2020 highs.
The Parabolic trading strategy
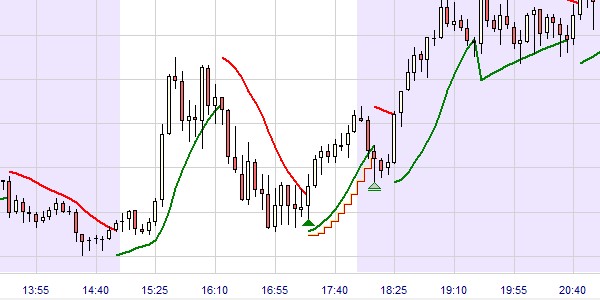
The strategy is performed in a 5-minute candlestick chart. It consists of the Parabolic indicator with its default setting. The trading is limited to the time interval between 3pm and 6pm thanks to two Block filters. A Parabolic stop, which is moved away by 5 ticks, ensures the protection of positions. Only long signals, i.e. bullish, are accepted. This strategy allows you to go hunting for opportunities as in the example below. The period when trading is allowed is recognizable by the white background. The periods when trading is prohibited are identified by a purple background. In the allowed period, there is a single bullish signal that produces a winning trade. The red stop is set at the previous local low. It then follows the Parabolic curve until the market turns and the position is closed.
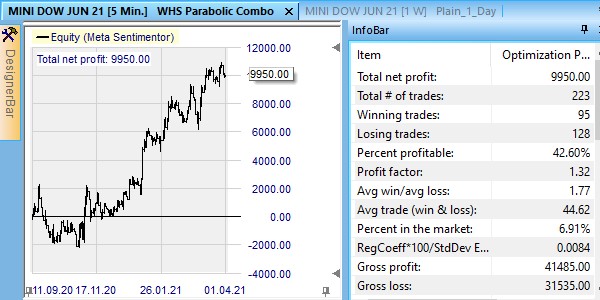
Interesting results
Since the autumn of 2020, this strategy has produced rather positive results as can be seen below by looking at the equity curve on the left and the performance statistics on the right. During almost 7 months, this strategy, which is limited to 3 hours of trading per day, has produced 223 trades, 42.6% of which were winners. The average win/loss ratio is very favourable at 1.77. The profit factor is good at 1.32. This performance parameter corresponds to the ratio of gross gains to gross losses. The further it is from 1, the better the quality of the strategy's performance.
Of course, this remarkable performance is not a sufficient condition to guarantee the success of the strategy in the future. Nevertheless, this strategy is a good basis from which a trader can, thanks to the back-testing functions of the NanoTrader platform, make adjustments that will perhaps extend its competitiveness in the future.
Conclusions
The Parabolic indicator is an excellent signal for capturing bounces. One way to use it is to filter it through a trend. In the case of this article, we were lucky enough to be in the presence of a rising Dow Jones index, which led us to retain only the long signals. With other instruments, we would have to evaluate the market conditions to define in which direction to trade (why not use the SNIPER indicator?). One could even imagine using the Parabolic indicator as a trend filter. In our example, we have seen that the Parabolic stop can be used effectively as it offers the advantage of limiting the risk and following the market when it goes in the direction chosen by the trader. In short, the Parabolic indicator is a multifunctional tool that deserves to be known and that all traders can learn to master relatively easily. It allows for the development of many day trading strategies like the one presented above.
People also read
Scalping trading ranges with the new Sniper
Trading volatility with the Eurex VSTOXX future
Free demo

Trading videos
Charting, strategies, automated trading, backtesting, playback... watch these videos and become a platform master.

Broker
WH SelfInvest serves traders from offices in Germany, France, Switzerland, Belgium, Luxemburg and the Netherlands.
The spectacular SignalRadar
SignalRadar shows live trades being executed by various trading strategies.
More ...
- 1 of 5
- next ›