Test NanoTrader Full I Test Tradingview I Test the mobile platforms All for CFD-Forex & Futures
You are here
The (new) Hikkake chart pattern for traders
Traders often use the Hikkake pattern to identify short-term trading signals. Daniel L. Chelser first developed it in 2003 and since then there have been several variations and improvements, with the Hikkake version in NanoTrader being the latest. These are advantages of the simplified Hikkake chart pattern in NanoTrader
- The pattern is easy to recognise and can therefore be used immediately by novice traders.
- Traders can easily identify possible entry points with a single glance at the chart.
- The pattern signals the start of a trend, leaving traders sufficient time to take advantage of the trend.
- It can be used in the analysis of multiple time frames to identify dominant trends
The traditional Hikkake pattern
The name of this pattern comes from a Japanese word meaning "hook" or also "to entwine". The traditional Hikkake pattern consists of four candlesticks. In the bullish Hikkake pattern, the first candlestick in the formation is bearish and is completely overshadowed by the previous candlestick. The following second and third candle form lower highs and lower lows. The fourth candle is a bullish candle with a higher low and rises to encompass the previous three candles.
In a bearish hikkake pattern, the first candle is overshadowed by the body of the previous candle. The second candle forms a higher high and a higher low, with subsequent candles forming lower highs and lower lows. The last candle in this pattern encompasses all other candles and closes below the first candle.
So what is the optimisation of the Hikkake pattern in NanoTrader?
For most traders, it is difficult and tedious to recognise the traditional Hikkake pattern. The new Hikkake pattern in NanoTrader simplifies this without compromising its effectiveness.
It consists of only two candles. As with the traditional Hikkake pattern, the first candle, also known as the "inside candle", is overshadowed by the body of the previous candle. The second candle in the pattern can have either a higher high and a higher low or a lower low and a lower high, depending on whether it is a bullish or bearish Hikkake.
Chart 1: A bullish Hikkake pattern in NanoTrader
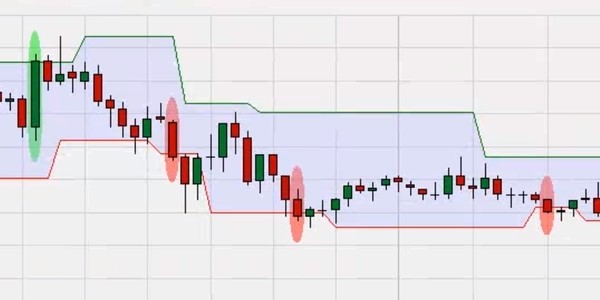
A bullish Hikkake pattern is formed when the previous candle fully encompasses the inner candle. The second candle has a higher high and a higher low than the inner candle. This candle shows that the price action is assuming an uptrend.
Chart 2: Mini S&P, 30-minute chart, 20-21 April 2021
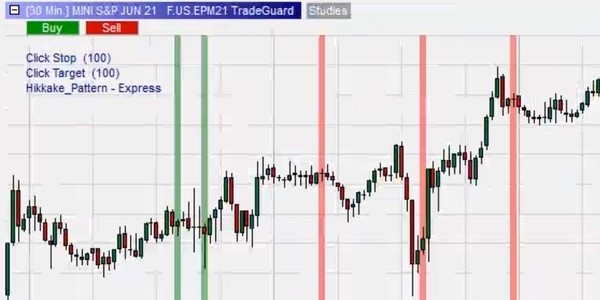
As can be seen in chart 2, NanoTrader turns green when the bullish Hikkake pattern develops. Traders can take advantage of this by using buy-stop orders to open a long position. The buy-stop price should be set slightly above the high of the inside candle. The logic behind this is that if the second candle breaks this level, it is a clear sign of an uptrend.
The bearish Hikkake pattern
A bearish Hikkake pattern is formed when the previous candle encompasses the inside candle, and the second candle forms a higher high and a higher low than the inside candle. This shows that the market is probably anticipating a downtrend.
Chart 3: Euro FX, 15-minute chart, 20-21 April 2021
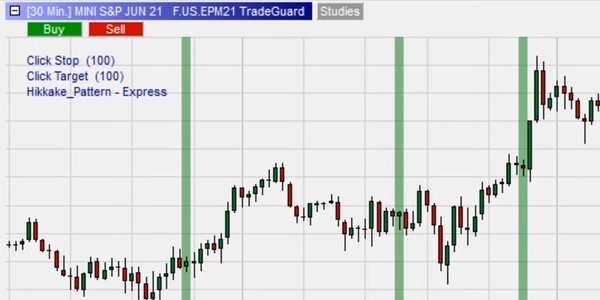
As can be seen in chart 3, NanoTrader turns the background red when the bearish Hikkake pattern is formed. A short sell signal is generated when the second candle closes below the inside candle. Traders can use sell stop orders placed slightly below the low of the first candle in the pattern.
Conclusion
Although the Hikkake formation shows clear entry signals, it does not indicate when a trend will end or when the trend will weaken. The trader must therefore be aware that the pattern is mainly to be used in short-term trading. Those looking for larger trends should use other tools in NanoTrader. However...
The Hikkake pattern gives a quite reliable indication in which direction the market could trend in the next few minutes. This is undoubtedly valuable information for day traders and also for scalpers.
Recommended managed account service
People also read
- The Hikkake pattern – Daniel L. Chesler
- Automated detection of chart patterns
- Define and detect your own candlestick patterns
Recommended broker
“It’s much easier to learn what you should do in trading than to do it. Good systems tend to violate normal human tendencies.”
- Trader William Eckhardt
Free demo

Trading videos
Charting, strategies, automated trading, backtesting, playback... watch these videos and become a platform master.

Broker
WH SelfInvest serves traders from offices in Germany, France, Switzerland, Belgium, Luxemburg and the Netherlands.
The spectacular SignalRadar
SignalRadar shows live trades being executed by various trading strategies.
More ...
- 1 of 5
- next ›