Test NanoTrader Full I Test Tradingview I Test the mobile platforms All for CFD-Forex & Futures
You are here
Filtering trading signals
Increased profitability thanks to intelligent filters at the opening of the position. This article deals with position entry and in particular the different filtering techniques to avoid false signals. First, we will cover some basic notions about entry techniques. Then, we will examine the different filtering possibilities on the NanoTrader trading platform.
Click here to test a free real-time demo of NanoTrader Full
BASIC PRINCIPLES FOR POSITION ENTRY
When entering the market, it is always a matter of finding a set of rules that best interpret the market movement you want to trade. It is important to distinguish between configurations that follow the trend and those that identify turning points in a trend to trade correction movements (so-called swing strategies). The use of the crossing of two moving averages such as MACD is an example of a classic trend following approach. An upward crossing of the two lines gives a buy signal and a downward crossing gives a sell signal. In this case, the crossing is really only completed once the period in question in the chart is complete. This means that entry at the earliest possible time is only possible at the close of the candle. Unfortunately, most of the time, you happily trade into position as soon as the defined configuration appears.
Unfortunately, this generally leads to frequent false signals, no matter what the entry method is.
This is where you start by adding additional filtering conditions. The objective is to reduce the number of false signals and at the same time the total number of trades (potential losses due to commissions!). This can be achieved with the following measures:
- Adding additional conditions in the configuration
- Definition of an additional entry condition
- Additional filtering conditions using indicators, time periods and/or aggregations
ADDITIONAL ENTRY CONDITIONS
Of course, the number of false signals or the number of transactions that reach break-even (here, transaction costs are usually included in the calculation) can be reduced by adding another configuration.
This immediately raises the question of how individual rules can be combined. The pure AND/OR combination is generally too rigid to obtain satisfactory solutions. In addition, it very quickly becomes clear that the different elements of the configuration for position entry contradict each other.
If Rule A gives a buy signal and Rule B a sell signal, is it neutral or should the buy signal be given more importance than the sell signal?
To solve this problem while maintaining the greatest possible flexibility, we have adopted a completely different approach when developing our software product "Dynamite Sentimentor": In order to be able to interpret an event accurately, we assign it a sentiment value between 0 and 100, the value 50 representing a totally neutral position. 100 is therefore a buy signal and 0 a sell signal.
This approach allows any indicator, any model, even fundamental events such as news, etc. to be interpreted in the same way. This allows to combine these values into a single weighted indicator, that we call the Meta Sentimentor.
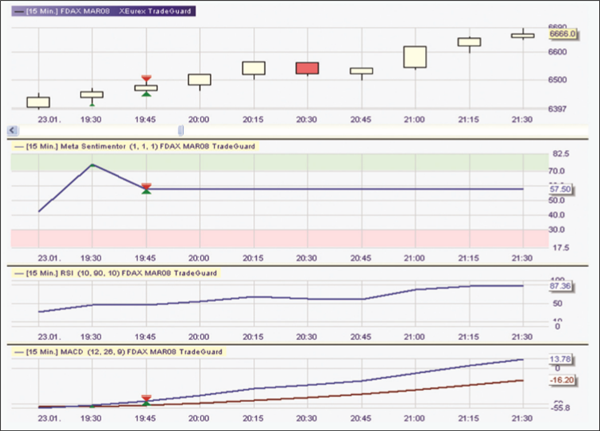
Figure 1 shows an example of a Meta Sentimentor with an RSI and an MACD as a signal trigger in a chart of the DAX future. 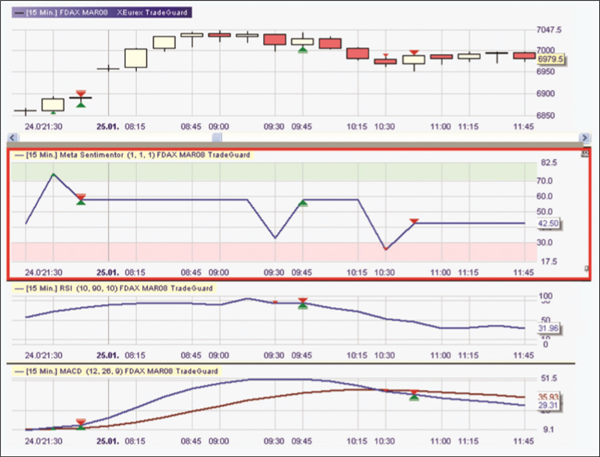

DEFINITION OF AN ADDITIONAL CONDITION (Entry)
Once the direction of a potential trade is determined, you need to know how to transform a signal into an order. Here, it is clear that everything depends on the time unit selected in the chart. As mentioned above, an interpretable event is only complete when the observed period (candle or data point in the chart) is over. If, for example, I have a 10-minute chart, I receive a data point every ten minutes in the form of a candle with information on the high, low, opening and closing prices of the last ten minutes and a data point in the indicator itself. Thus, the signals of the configuration can be executed at the closing price of the candle during which the signal occurs or at the opening price of the next candle. In today's volatile and rapidly changing markets, trading rules alone are not enough to ensure success. However, adding filters will filter false signals. Here are some examples:
- Entry only at the highest or lowest of the last x periods.
- Entry only when the closing price of the next bar is higher or lower than the opening price.
- Entry only if the high/low of the next bar is lower/higher than the high/low of the signal bar and the closing price is higher/lower than the opening price.
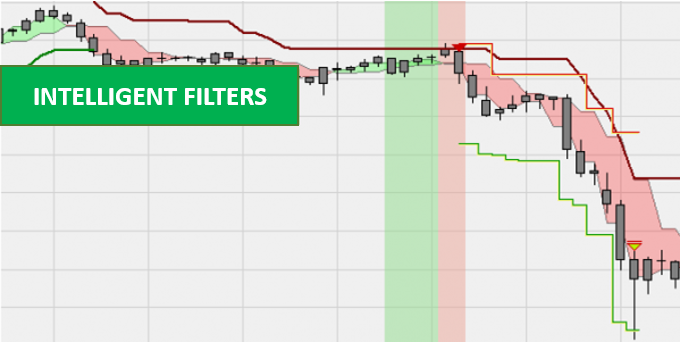
Many combinations are possible, so there are no limits to your imagination. Nevertheless, there are two things to be aware of. First of all, the filtering condition must confirm the direction of the original signal and you must make sure that you do not filter the movements, thus eliminating any profitability from the trading system. Figure 2 shows a buy signal (small green arrow), which is only traded when the high of the next candle is greater than or equal to the high of the signal candle (large green arrow).
Figure 2 : An example of a confirmation at the next bar by a crossing above the high of the signal candle.
FILTER OF INDICATORS, TIME UNITS AND/OR AGGREGATIONS
Indicators can be integrated into the Meta Sentimentor as signal triggers, but they can also be defined as filters. The indicator will then not generate buy or sell signals, but filters the signals to allow only those signals that correspond to the direction indicated by the indicator. This is particularly useful in a system following the main trend. As an example, let us take the DAX future, which has recently become very volatile on an intraday basis. Simple break-out approaches can also be profitable when volatility is high. This trend approach requires, as its name suggests, strong trend movements. To identify the profitable phases for this trading approach, you would need an indicator that can measure the strength of the trend. An indicator, so to speak, that is inserted into the strategy as a filter to allow signals generated in the break-out direction in phases with a strong trend, but to block them in lateral oscillatory movements.
An oscillator type indicator is perfectly suited for this purpose. In our example, I programmed an indicator using the Express language developed by DySen, which calculates the distance between the closing price and a moving average (MA) of closing prices. So Close-MA10. For the chart of the DAX future in 15-minute candles, I chose a fast-moving average in ten periods (= 150 minutes) so that the reaction time is not too slow. To trigger the signal, the high and low prices of the last ten periods are also drawn as a band around the 15-minute candles in the chart. If the closing price of a 15-minute candle is higher or lower than the highest or lowest of the last ten periods, a trade is placed in the direction of the break-out, i.e. above the highest or lowest of the last ten periods. Figure 3 shows the result of the strong downward phase from January 18 to 24 with two highly profitable trades. However, most of the gains realised will have to be given up from 22 January onwards due to the weakening trend. This is shown very clearly by the equity curve below the chart.
Figure 3 : A simple break-out system on the DAX future in 15 minute-candles is naturally profitable in trend movements even without a filter, but gives many false signals.
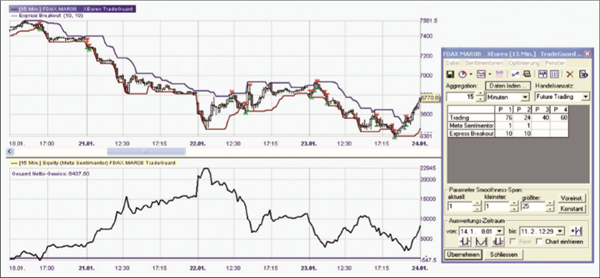

Figure 4: The green line measures the distance in absolute points between the closing price and the moving average in 10 periods. If the indicator oscillates between the zero line (= point of intersection with the moving average) and +/- 80 points on the DAX future, no trend is identified and all signals are filtered. Also note the green and red background, which indicates whether the buy (green), or the short (red) signals are accepted.
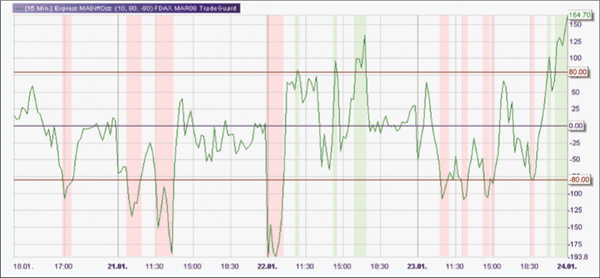
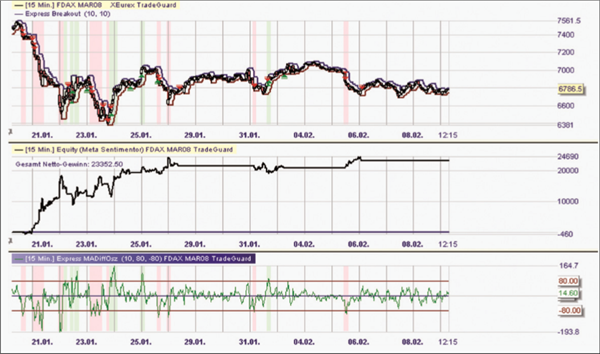
Figure 5 clearly shows that, at the end of January/beginning of February, the volatility and therefore the strength of the Dax trend is decreasing. We use our MA-oscillator to filter the signals (Fig. 4). Indeed, by adding our filter, the number of false signals can be considerably reduced, allowing the net result, after withdrawal of a commission of five euros plus a tick in slippage per round turn, to go from 6437 to a fabulous 23 352 Euros. My Fröhlich factor (FF), which I developed, improved from 0.48 to 6.13 with this measure alone.
Figure 5: A break-out system without filter in 15-minute candles from 18.1. to 8.2.2008. The strength of the trend is clearly declining after January 25th, generating too many unprofitable trades.
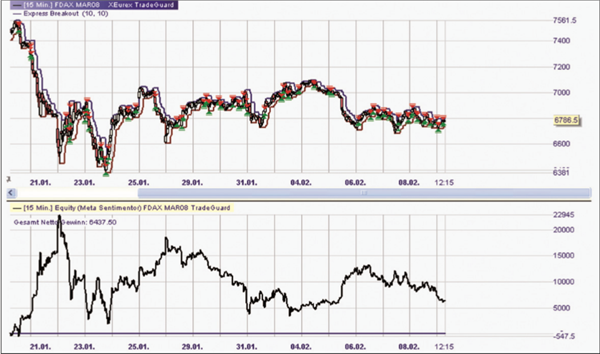
Figure 6: By using the MA oscillator as a filter, the number of false signals is considerably reduced and the system becomes much more profitable.
Another way to work effectively with filters is to add time or aggregation filters as an additional entry rule. How this works is explained in another article.
CONCLUSION
Experts are convinced that exit rules are more important than entry rules. This is undoubtedly the most important part of controlling the risk and the evolution of the trading account. However, it is also true that a profitable position can only be achieved with as large a price movement as possible in the direction of the trade. It is possible to increase probability by effective filtering of entry signals, which will not only reduce false signals, but also the psychological barriers that might exist for the implementation of such a system. If a set of rules is proven in a test and its profitability is high, it will be easier to add the necessary control mechanisms by supplementing the stop and capital management rules without negatively affecting the system as a whole.

Free demo

Trading videos
Charting, strategies, automated trading, backtesting, playback... watch these videos and become a platform master.

Broker
WH SelfInvest serves traders from offices in Germany, France, Switzerland, Belgium, Luxemburg and the Netherlands.
The spectacular SignalRadar
SignalRadar shows live trades being executed by various trading strategies.
More ...
- 1 of 5
- next ›