Test NanoTrader Full I Test Tradingview I Test the mobile platforms All for CFD-Forex & Futures
You are here
A good trend indicator
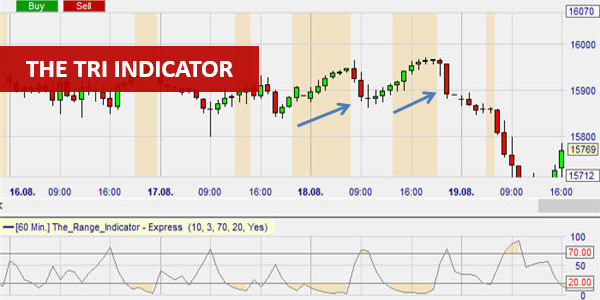
The TRI indicator is simple and efficient at the same time. The TRI indicator recognises the trend promptly. That is good. But what really sets the indicator apart is its ability to follow the trend and indicate when the trend will end. Exiting a position at the right time is the key.
A very good indicator to follow the trend
The Range Indicator (TRI) was developed by trader Jack Weinberg. Weinberg uses a TRI < 20 as the indicator of a trend. When the TRI moves above this level the trend is weakening. When the TRI is above 70 the trend is completely finished and the market is often back where it started. The interesting period starts the moment the TRI dips below 20.
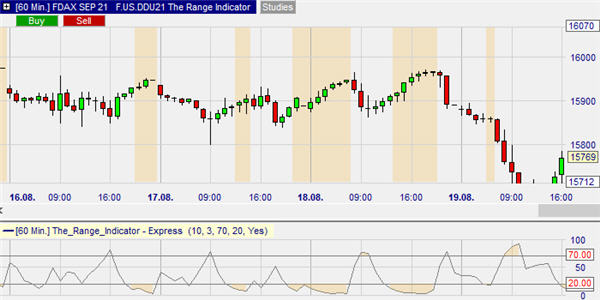
This example shows a 60-minute chart of the DAX market index. The TRI is visible below the chart. The periods when the TRI is interesting for traders, are also shown in the main chart by a coloured background. With the exception of the last period, where the trend does not develop, it is clear that the periods indicated by the TRI are interesting for traders.
People also read
“Money is only a tool. It will take you wherever you wish, but it will not replace you as the driver.”
- Ayn Rand
Free demo

Trading videos
Charting, strategies, automated trading, backtesting, playback... watch these videos and become a platform master.

Broker
WH SelfInvest serves traders from offices in Germany, France, Switzerland, Belgium, Luxemburg and the Netherlands.
The spectacular SignalRadar
SignalRadar shows live trades being executed by various trading strategies.
More ...
- ‹ previous
- 2 of 5
- next ›