Test NanoTrader Full I Test Tradingview I Test the mobile platforms All for CFD-Forex & Futures
You are here
Volume trading or order flow trading
In this article we would like to introduce you to the basics of volume trading (order flow trading). As with any trading approach, there are some technical terms that traders should know - and which we would therefore like to explain first before presenting concrete strategies. If you are already somewhat familiar with the basic concepts of volume trading, you can immediately go to the more specialised articles in the "People also read" section, including the highly recommended article "The sensational Volume Viewer for futures".
Volume trading or Order flow trading
Volume indicators
As the name suggests, volume trading is based on trading volume. Most traders know this from the chart, where it is usually displayed at the bottom as a bar chart. It shows the traded volume in a certain period (volume over time). If the trader is looking at a 5-minute chart, the turnover is shown in the respective five minutes, for example from 09:15 to 09:20.
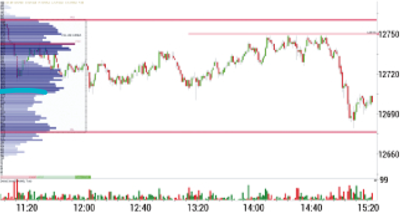
The Volume Profile (Figure 1), however, is a horizontal volume indicator that shows the volume at a certain price level (volume per price). A distinction is made between three types:
- The Volume Profile Micro shows the volume profile on footprint charts (representing price, volume and order flow at one data point), tick charts or very small time units. It is primarily used for scalping.
- The Volume Profile Intraday shows the volume profile of the day and is used to find the most important levels and zones of the current day.
- The Volume Profile Composite shows the volume profile of the complete contract over a longer period of time and is used to find resistance and support.
Figure 1. Volume profile. The Volume Profile is a horizontal volume indicator that shows the volume at a given price level (volume per price).
Another important indicator is the Volume Weighted Average Price (VWAP for short). This is the volume-weighted average price of a given trading day. Unlike a moving average, it also takes into account the trading volume of the individual prices and thus makes a valuable statement about the fair price of the day so far. Since this is relevant for many institutional traders, the VWAP often acts as a magnet in sideways phases to which the price likes to return. However, in a market showing a trend the VWAP can develop into support or resistance.
A highly recommended broker often used by volume traders becaue they provide real tick-by-tick data.
The order book
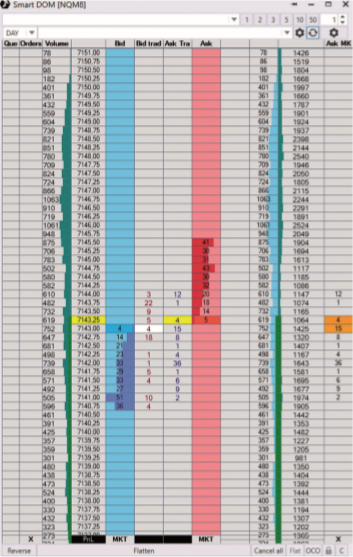
The order book is also called DOM, short for Depth of Market. Figure 2 shows the order book with the best bid and ask prices. With most brokers, it can also be used directly for placing and moving orders. In addition, professional orderflow trading platforms offer a variety of plug-ins and the possibility to freely design the DoM, for example via the so-called "smart DoM". The biggest problem for orderflow traders today are algorithms, especially high frequency traders (HFTs). The smart DoM tries to recognise and analyse such algorithms.
Figure 2: Order book. The chart shows the order book with the best bid and ask prices. It is also called DOM (Depth of Market) and can be freely configured, for example, via the so-called Smart DOM.
Time and sales
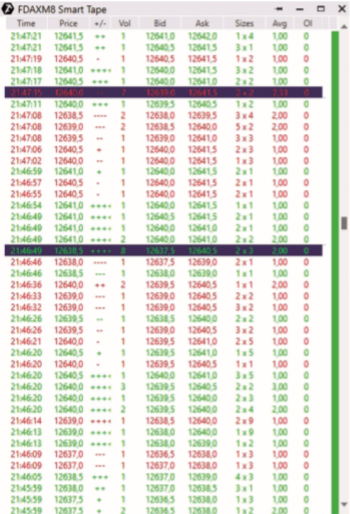
The time&sales list (Figure 3) is an overview of the transactions actually executed and, together with the order book and charts, is one of the best tools for day trading. It shows each individual trade of an instrument with the exact time of execution, price and volume. With the times&sales list alone it is quite difficult to gain an advantage, but together with the order book and the charts all the pieces start to fall into place.
Figure 3. Time&Sales. The time & sales list is an overview of all the trades that have actually been executed. A lot of additional information, including colour coding (trade at bid or trade at ask) is provided for the attentive observer.
The analyses of Bid and Ask
Bid is the current best price in the market at which buyers are willing to buy. Ask (ask price) is the best price at which sellers are willing to sell. In other words: If they buy with a Market order, they buy a limit order from the Ask side. If they sell market, they sell to a limit order on the bid side. Therefore, with a market order, you lose the spread between bid and ask.
Important: certain specialised trading platforms such as NanoTrader (free demo) can actually manage your order automatically so a buy is at the best bid, and a sell at the best ask. Quick traders, in the right direction can simply earn the spread.
Upward movements are triggered by one or more traders buying at the ask price. As soon as a particular price level no longer has a limit order on the ask side, the price moves to the next higher level (this is called an uptick). Conversely, falling prices are triggered by one or more traders selling at the bid. As soon as a price level on the bid side no longer has a limit order, the price drops to the next level (this is called a downtick).
In addition, quick price movements can also be triggered if many bid or ask offers are suddenly withdrawn or adjusted to a higher or lower level, for example after important news.
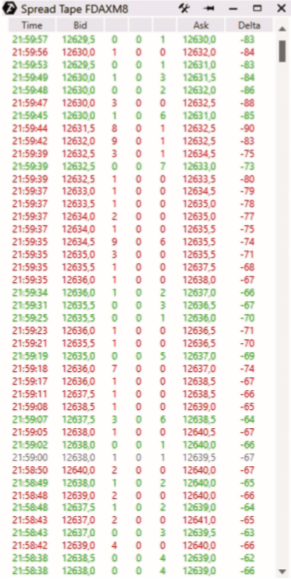
The spread tape (Figure 4) shows the trading volume based on bid and ask that was transacted during a price movement. This is very useful to analyse the transaction behaviour of other market participants while approaching a certain price level. In addition, you can also see the volume within the spread as well as the cumulative delta (indicating whether buyers or sellers dominate).
Figure 4: Spread tape. In the spread tape you can see the trading volume that was transacted in the course of a price movement based on bid and ask.
Another useful tool is the order flow imbalance or the bid/ask imbalance chart. With the help of a filter, it is possible to measure the effects of the executed market orders on bid and ask and thus to recognise more aggressive market participants. In other words, a certain buying or selling pressure can be identified so that one does not position oneself against the prevailing order flow.
Conclusion
With orderflow trading, traders no longer observe the markets from the outside, but from the inside - they see the heart and the blood flow of the markets.
This is an overviey of the most important concepts in volume trading. In order to be able to use these to your advantage, we recommend you read the articles in the "People also read" section.
- Point of Control (POC): Level at which the largest volume was traded.
- Value Area (VA): Area at which at least 70 percent of the daily volume was traded.
- Value Area High (VAH): upper limit of the Value Area.
- Value Area Low (VAL): lower limit of the Value Area.
- High Volume Nodes (HVN): Price levels at which a lot is traded.
- Low Volume Nodes (LVN): Price levels at which the trading volume is low; in the event of a movement, these zones are usually overcome quickly.
- Delta: Net difference between bid and ask.
- Footprint Delta: Net difference between bid and ask at each price bar.
- Delta: Net difference between bid and ask of the respective bars.
- Cumulative delta: Net difference between bid and ask on the entire trading day.
- Source: Traders' Mag.
People also read
- Volume profile... key price levels
- The sensational Volume Viewer for futures
- More VWAP and TWAP functions
- VWAP and TWAP, a basis for trading strategies
"It’s hard to beat a person who never gives up."
- Babe Ruth
Free demo

Trading videos
Charting, strategies, automated trading, backtesting, playback... watch these videos and become a platform master.

Broker
WH SelfInvest serves traders from offices in Germany, France, Switzerland, Belgium, Luxemburg and the Netherlands.
The spectacular SignalRadar
SignalRadar shows live trades being executed by various trading strategies.
More ...
- 1 of 5
- next ›