Test NanoTrader Full I Test Tradingview I Test the mobile platforms All for CFD-Forex & Futures
You are here
A swing trading strategy using CoT report data
What if you could profit from the knowledge of the ultimate professionals and specialists of the instruments you trade? In this article you will learn one way to do just that.
Important: Trading with COT data is only possible with futures. If you are interested in futures trading, enjoy reading these FREE e-books...
How to scalp the Mini-DAX future? I Futures and futures trading I Trader profile – The Scalper
Using the CoT report data
Access the expertise of specialists
There are large companies that either produce or consume raw materials. In both cases, market prices have a high share in the profitability of the respective company. The level of profit of these companies depends heavily on the prices of the raw materials they either purchase for further processing or sell on the market. In this context, it is naturally good for a producer if raw material prices are as high as possible. For a company that consumes raw materials, on the other hand, low prices are ideal.
Futures have emerged as trading instruments to enable these companies to hedge against sharp fluctuations in commodity prices in order to achieve a certain degree of planning certainty. It can be assumed that market participants who produce or consume a particular commodity know the entire fundamental situation very well, as well as the current supply and demand conditions. The group of market participants with this insider knowledge is called commercials or commercial hedgers.
Commercials react to a change in the situation on the respective commodity market by adjusting their long and short positions in futures and options. In doing so, they rely on their extensive knowledge of the commodity markets in question. In some cases, they spend millions annually to maintain the best research departments and obtain the most accurate information. Even much of the information contained in government reports on commodities, such as the important WASDE report, comes from the commercials.
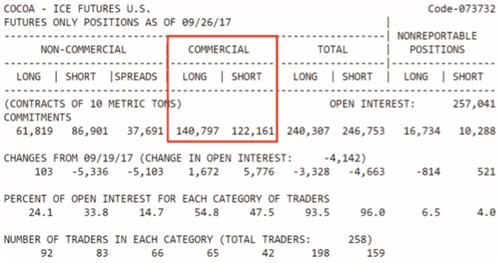
And now the good news: The exact amount of the open positions of these market participants is published free of charge every Friday by the CFTC (Commodity Futures Trading Commission) (Fig. 1) to ensure transparency in the markets and to prevent manipulation. In the following, you will learn how knowledge of these positions can be used profitably.
Figure 1: Open positions in cocoa futures. The chart shows an example of the Commitments of Traders (COT) report for cocoa. The positions of the commercial hedgers are framed in red.
Objective of the CoT data trading strategy
Our trading strategy is about identifying approaching trend reversals through the positioning of commercial hedgers. The guiding principle of this strategy is that the higher or lower the price of a commodity goes, the more the commercial hedgers increase their hedging positions. It is important to understand that the two groupings within the commercials, namely the buyers and the sellers of a commodity, serve each other. Their behaviour is predominantly determined by supply and demand. In a perfect world, producers would produce and sell exactly the amount of commodities needed by consumers - so prices would be stable. However, we do not live in a perfect world. The basic conditions for demand are constantly changing, as are the conditions for production. That is why there is always oversupply or shortage in the markets. At times of low demand and/or high production, prices fall and vice versa. The further prices fall, the more likely producers are to stockpile their products, as profits are correspondingly low. In extreme cases, market prices may even be below production costs. In such cases, the consuming companies will try to secure the low prices for as long as possible. So then predominantly long positions are held.
Recommended broker:
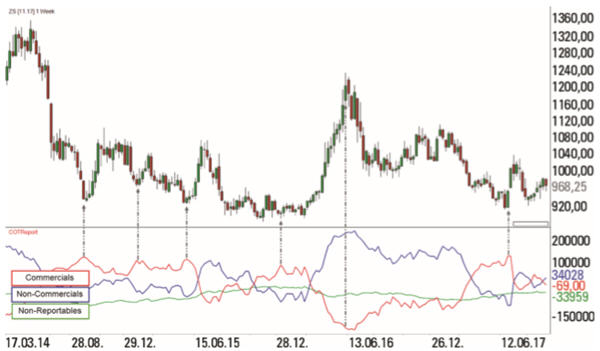
This is exactly what can be seen in the commercials' positions published by the CFTC. As long as these positions are within a normal range, there is no need for action because supply and demand are relatively balanced. We want to act whenever there are anomalies in this relationship, because sooner or later these will be offset by price adjustments. In Figure 2, you can see from the example of soybean futures that prices rise after commercials go long and fall after commercials go short.
Figure 2: COT data for soybean futures. One can see from the example of the soybean future that the prices rise after extreme positions of the commercials on the long side and fall after extreme positions of the commercials on the short side.
The biggest problem in evaluating the COT data, however, is to determine the right time to enter a long or short position just by interpreting it. It is not said for nothing that the commercials have very deep pockets. They can withstand movements that run against their futures positions for an extremely long time. By being in their main business of physical commodities, they always have a counterbalance to their positions in the financial market. For example, if Starbucks, as a coffee roaster, builds up long positions in the futures market to secure low prices, but prices continue to fall, Starbucks suffers losses with its futures positions, but can currently buy the coffee it needs at lower prices, which partly offsets this. Therefore, in order to enter a swing trading position, we need not only an extreme positioning of the commercials, but also an indicator that tells us when to enter.
The indicators
Two indicators are used to determine the exact entry point: the so-called Commercial Index and the Relative Strength Index (RSI)*. The former relates the current net position of the commercials to the minimum and maximum value of a given period. A period of three years has become widespread among long-term swing traders, but there are very few signals within a year in this long-term snapshot. Since the trading signals of the approach presented here come from the daily chart, the 10-week period is used. The Commercial Index turns the net positioning of the commercial hedgers into an oscillator that moves between zero and 100:
Commercial-Index = (aktuelle Nettoposition - minimale Nettoposition) / (maximale Nettoposition - minimale Nettoposition)
Values above 90 or below ten mark extreme values and make us take notice of the corresponding market.
The RSI, on the other hand, compares the strength of price losses with the strength of price gains within the set period. In the broadest sense, it is a momentum indicator designed to identify price areas where an underlying is overbought or oversold. We use an eight-period setting on the daily chart and always take the opposite trade direction.
Rules for setup, entry and exit
The following basic conditions must be met for the long setup (short analogue):
- Commercial index above 90 (for short below ten).
- Oversold RSI below 30 (for short above 70)
The entry is chosen on the daily chart when the RSI reaches back into or trailing stop from the oversold area. In this strategy, we do not trade with a price target, as we want to find long-lasting trends very early and hold the position as long as possible.
The initial stop is based on the current chart picture. The stop is set either at the extreme point of the previous movement or at a relative high/low if the new trend has already started on the daily chart.
The trailing stop is always based on the initial stop and is tightened in risk multiples. If, for example, an initial stop of 110 ticks is required, the trailing stop is tightened by exactly 110 ticks every 110 ticks that the trade runs into profit. Figure 3 shows four exemplary trades from the soybean future.
Figure 3. Trade examples soybean futures. Here you can see four examples of the COT strategy. The sub-charts show the signals in the Commercial Index and the RSI. In the first trade there was no entry because the high of the signal day was not exceeded. Trades number 2 and 3 were stopped out at break-even, after the risk had already been earned as a book profit. Trade number 4 went very well. The trailing stop was adjusted five times before the position was stopped out.
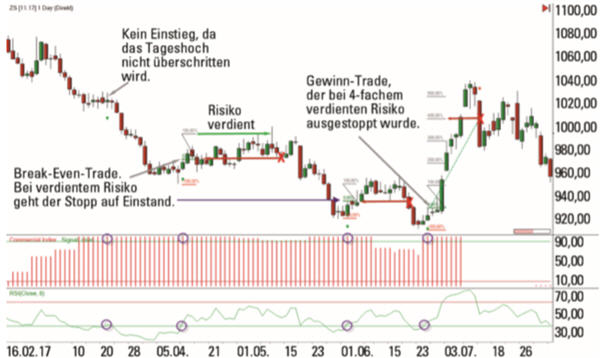
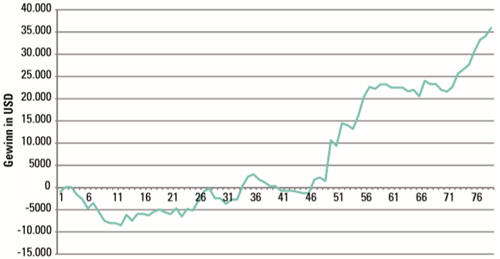
Figure 4 shows the capital curve of the current trading year for a total of 17 futures markets. For each trade setup, one contract was traded in the respective market. There were a total of 110 trade opportunities, of which 40 positions were not executed or closed out at breakeven. The hit rate of the remaining trades was exactly 50 percent. Five positions are still open. The profit so far has been around 40,000 US dollars.
Conclusion CoT trading strategy
COT data is considered a proven indicator. The author currently trades the strategy on 26 futures markets, including major currency pairs against the US dollar and many liquid commodities from the metals, energy commodities, agricultural commodities and meat products sectors. However, to trade this strategy on such a large variety of markets in parallel, the trading account should be around $100,000 in order to meet margin requirements and survive any drawdowns without damage. Traders with smaller accounts can reduce the number of markets traded or implement the trades with CFDs.
Martin Goersch has been a full-time trader for 15 years. He runs the training company DaytradingCoach and is Head of Trading of a Swiss asset management company. Source: Traders' Mag.
Feedback from traders
"I am enthralled with the possibilities NanoTrader offers." – A.G.
"Thank you again for your service. It's been years and I'm still as satisified as ever." – M.N.
Thank you for your clear explanations. WH SelfInvest really has the BEST CUSTOMER SERVICE. – S.K.
People also read
The Commitments of Traders Report (CoT) Part 1
The Commitments of Traders Report (CoT) Part 2
Recommended broker
Recommended managed account service
“In this business, if you’re good, you’re right six times out of ten. You’re never going to be right nine times out of ten.”
- Peter Lynch
Free demo

Trading videos
Charting, strategies, automated trading, backtesting, playback... watch these videos and become a platform master.

Broker
WH SelfInvest serves traders from offices in Germany, France, Switzerland, Belgium, Luxemburg and the Netherlands.
The spectacular SignalRadar
SignalRadar shows live trades being executed by various trading strategies.
More ...
- ‹ previous
- 2 of 5
- next ›