Test NanoTrader Full I Test Tradingview I Test the mobile platforms All for CFD-Forex & Futures
You are here
Day trading with a breakout
If you are a trader, you have certainly heard of breakout trading. It is a very effective method that can give traders stable profits in the futures markets without using indicators. In this article we will explain how to recognise and profit from intraday breakouts. First, let's clarify what breakouts are.
What is a breakout (and what isn't)?
A bullish and a bearish breakout
Financial markets are characterised by two conditions: Trend phases and consolidation phases. When the market consolidates, liquidity usually decreases and the future trend direction is not significantly clear. On the opposite, a trend market indicates a clear direction with an occasional strong momentum of a value. The moment when the breakout from a consolidation coincides with extended volume is called a breakout. As always, there are two types of breakouts: bullish and bearish. Below are examples of both situations.
Figure 1: GOLD Future, 5-minute chart, NanoTrader trading platform (free demo)
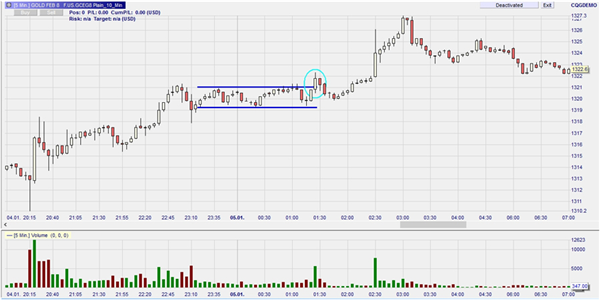
A bullish breakout occurs when the price starts to break out upwards after a period of consolidation. The most reliable bullish breakout is when a bullish candle develops alongside the rising momentum, as seen here in the GOLD futures example. Shortly after the breakout occurred, the market began to rise significantly. A good breakout trader can profit from this scenario by opening a long position after the breakout candle.
Figure 2: Gold, 5-minute chart, NanoTrader trading platform (free demo)
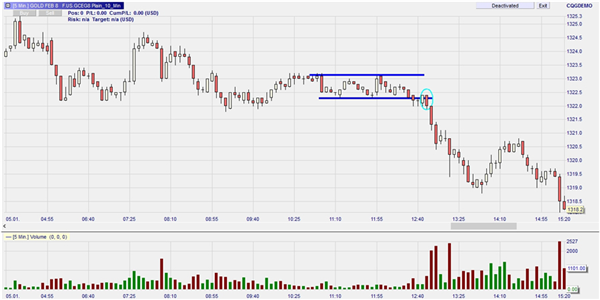
Reversely, we speak of a bearish breakout when the price starts to break out downwards after a consolidation phase. As with the bullish breakout, we speak of a bearish breakout when a clear "red" or bearish candle generates below the consolidation. Ideally, this should be accompanied by an increase in volume, as it was the case in this gold future example.
Identifying a trade opportunity
it is essential to keep in mind that the breakout candle must be fully closed before making a trading decision, as the market can return to the consolidation zone and thus destroy the trading opportunity. Also, the trader should not forget the current trend direction of the market. If the general direction is long, he should consider a short trade very carefully. This is the only way to increase the probability of success.
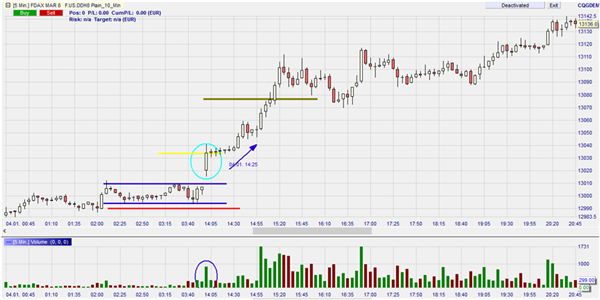
Let's take a closer look at this clear trading opportunity to learn more about the strength of this strategy. We have added some support and resistance lines to illustrate the example. This is the 5-minute chart of the FDAX on 4 January 2018. As you can see the consolidation is set between the two blue horizontal lines. The market opened with a price gap and then formed a bullish candle with a sharp increase in volume. If the trader observes this trading opportunity, he can enter the market with a buy position even before the breakout candle closes. He should place the stop loss just below the lower parallel line of the consolidation. To calculate the take profit point, he can measure the distance from the entry point to his stop loss and then place the target likewise. In that case, he would work with a risk-reward ratio of 1:1. This is not outstanding, but the hit rates are significantly higher than usual during strong breakouts like these.
Figure 3: DAX Future, 5-minute chart, NanoTrader trading platform (free demo)
A recommended managed account service
People also read
- The best solution for Bitcoin trading?
- Day trading with breakouts (Part 2)
- The S&P 500 Night Rider trading strategy
“Traders need a daily routine that they love. If you don't love it, you're not gonna do it.”
- trader Scott Redler
Free demo

Trading videos
Charting, strategies, automated trading, backtesting, playback... watch these videos and become a platform master.

Broker
WH SelfInvest serves traders from offices in Germany, France, Switzerland, Belgium, Luxemburg and the Netherlands.
The spectacular SignalRadar
SignalRadar shows live trades being executed by various trading strategies.
More ...
- 1 of 5
- next ›