Test NanoTrader Full I Test Tradingview I Test the mobile platforms All for CFD-Forex & Futures
You are here
DAX or DOW with the D&D trading strategy
Here is an interesting question. The D&D Range Bar Scalper strategy was so named because its designers noticed, almost two years ago, that it was producing good results on the Dax and Dow futures. Since then, many users have dubbed it the "D&D" strategy and it is fair to ask which of these futures they are most successful with. In this article, we recall the philosophy of this strategy as well as the elements that make it up. Then, we conduct a comparative analysis that should allow us to draw conclusions and answer the question posed.
1. The philosophy behind the D&D trading strategy
The D&D strategy was originally designed for scalpers looking to take advantage of small market movements at a time when daily volatility was historically low around 1%. In a period of low volatility, it makes sense to (1) reduce chart aggregation to show trends and (2) develop a strategy that detects these trends and offers quality signals in the direction of the trend.
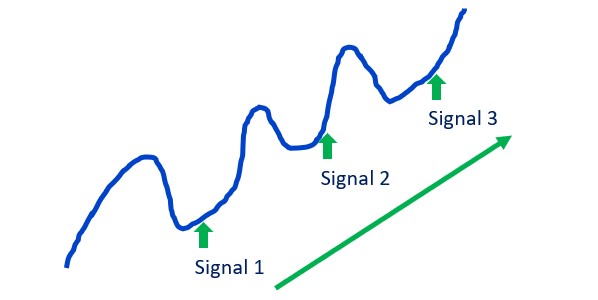
Below is an example of an upward trend in the form of a blue price curve. It moves in a zig-zag upwards. To define the existence and direction of a trend, one only needs to look at the lows formed by the price curve and see in which direction they are moving. Here, the lows are rising, so the trend exists and is upward. To exploit a bullish trend, one needs signals that allow him to enter a position at the lows and in the direction of the trend. In this case, the probability is high that the signals will generate winning trades and that his strategy will be profitable.
2. Components of the D&D strategy
The absolute range chart
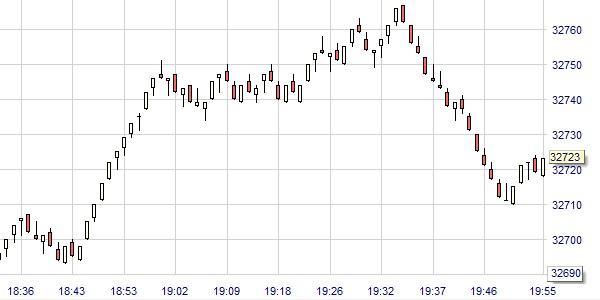
In order to look for trends, we had to reduce the aggregation of the chart and use the absolute range chart, also known as the range bar chart. Below is a 5-point absolute range chart. One of its advantages is that it shows strong movements in a succession of candlesticks, which gives scalpers the opportunity to enter positions earlier than in a traditional candlestick chart.
Other properties of the absolute span chart are as follows:
- This chart is constructed from candlesticks whose amplitude is limited to a given number of points.
- The design of the candlesticks is based on the incoming flow of transaction prices reported by the exchange on which the financial instrument is traded. As soon as a price exceeds the maximum amplitude of the existing candle, a new candle is created.
- As long as the price remains within the range defined by the amplitude of the existing candle, there are no new candles.
- The time gaps in the horizontal scale are uneven. There are gaps of 9 minutes (between 19h09 and 19h18) and gaps of 5 minutes (between 19h32 and 19h37).
The trend filter
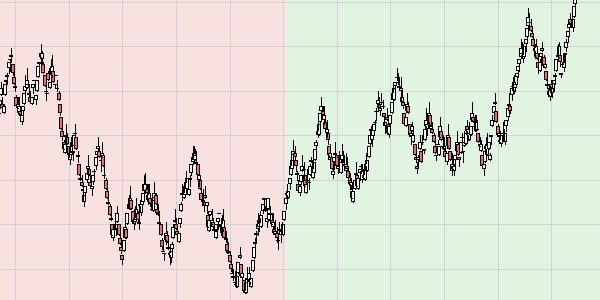
The trend is detected by the DDTrendFilter, which only accepts signals in the direction of the trend. To find out the direction of the trend, one only needs to look at the colour of the background: downtrend in red and uptrend in green, as in the following example.
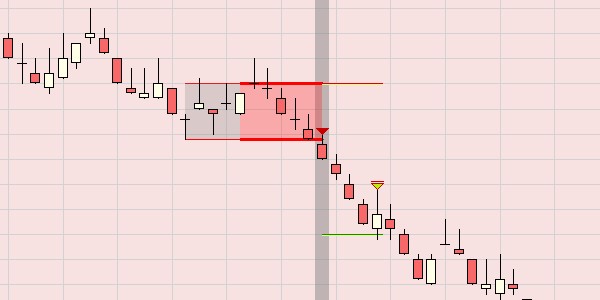
The range break-out signal
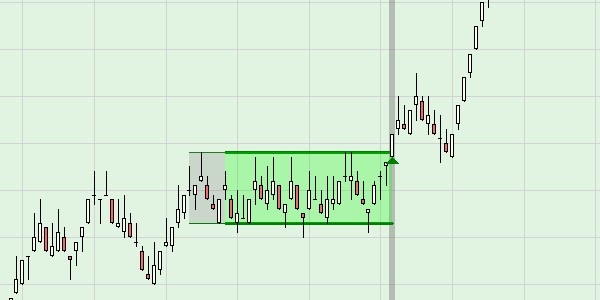
After an advance, prices often tend to stagnate within a horizontal price range. A Range Breakout signal is generated when the price closes outside the range, either from below producing a bearish signal or from above producing a bullish signal as in the example below.
The stop and price target orders
The D&D strategy uses stops and targets that are set at the price levels that define the Range Breakout signal. In the example of a bearish trade below, the stop is positioned at the top of the price range while the target is positioned at 1x the risk. The risk is the absolute value of the distance between the stop and the entry price.
3. Comparison between Mini-DAX and Mini-DOW
We begin our analysis with a review of the characteristics of these two ultra-popular futures among our readers:
- Similar trading hours: Mini Dax and Mini Dow futures trade virtually all day and at almost the same times.
- Similar point values: €5 for the Mini Dax and $5 for the Mini Dow.
- Similar minimum price spread values, called tick, 1 point for the Mini Dax and Mini Dow.
- Nominal values ... from simple to double! 72500 for the Mini Dax against $164000 for the Mini Dow. This creates an advantage for the Mini Dow because for the same % variation and similar fees, one can make twice the profit.
- Daily volatility (110 days) slightly more favourable to the Mini Dax: 1.75% for the Mini Dax against 1.58% for the Mini Dow.
- Hourly volatility (110 days) more favourable to the Mini Dax: 0.77% for the Mini Dax at the opening of the German markets against 0.53% for the Mini Dow at the opening of the US markets.
We now analyse, for each of these futures, a back-test of the same D&D strategy over the last 250 days. The only difference in the settings is the trading period: 9am - 1pm for the Mini Dax and 3:30pm - 10:10pm for the Mini Dow.
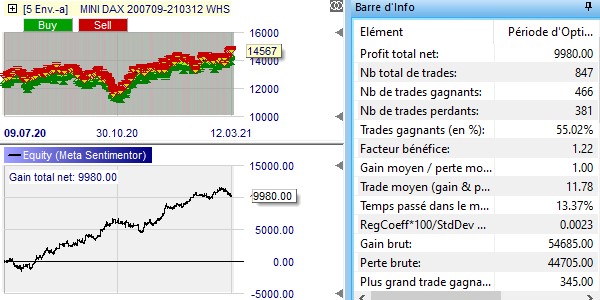
Below, the back-test of the Mini-DAX.
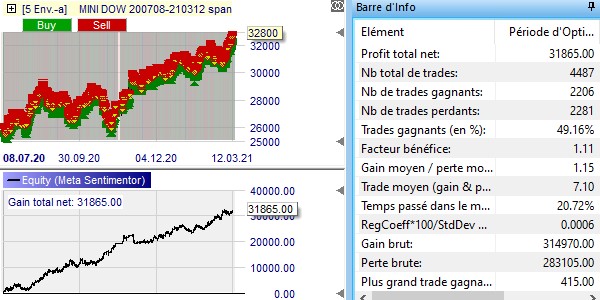
And now the back-test of the Mini-DOW.
When analysing these results, the following remarks can be made:
- Results: positive for both, but advantage for the Mini Dow with a 3x bigger profit. €9980 for the Mini Dax and $31865 for the Mini Dow.
- Aspect of the results curve: advantage for the Mini Dow with a steep curve but less volatile than the Mini Dax.
- Number of trades: advantage for the Mini Dax with much less trades. Too many trades increase the costs. 847 trades in 4h per day for an average trade of €11.78 for the Mini Dax. 4487 trades in 6.67h per day for an average trade of $7.10 for the Mini Dow.
- Success rate: advantage for the Mini Dax with 55.02% against 49.16%.
- Average gain/average loss: advantage for the Mini Dow with 1.15 against 1.00.
- Profit factor: advantage for the Mini Dax with 1.22 against 1.11. The profit factor is the best measure of the profitability of a trading strategy. It is equal to the ratio of the sum of gains to the sum of losses.
Beware, experience shows that one should be wary of interpreting the results of a back-test, especially if the chart has an aggregation of less than 1 minute or if the distance between targets and stops is less than 15 ticks. Indeed, in these cases, the differences between the theoretical prices of the back-test and the real prices can be sufficiently large that they can call into question the conclusions of the back-test.
4. Conclusions
We have to be fair with every future. The Mini Dax and the Mini Dow have a lot of quality and their results look promising. From a results point of view, the Mini Dax has a slight advantage because it generates fewer trades than the Mini Dow and has a higher profitability. From a practical point of view, if one wants to trade in the morning, he has to choose the Mini Dax and if one wants to trade in the afternoon or evening, he has to choose the Mini Dow. So, one cannot completely replace the other. We can therefore rule on a draw between these two stars!
Free demo

Trading videos
Charting, strategies, automated trading, backtesting, playback... watch these videos and become a platform master.

Broker
WH SelfInvest serves traders from offices in Germany, France, Switzerland, Belgium, Luxemburg and the Netherlands.
The spectacular SignalRadar
SignalRadar shows live trades being executed by various trading strategies.
More ...
- ‹ previous
- 4 of 5
- next ›