Test NanoTrader Full I Test Tradingview I Test the mobile platforms All for CFD-Forex & Futures
You are here
Market heatmap for traders
The market heatmap allows the trader to determine three percentage bands for the size of the market movement. For example:
Band 1: < 0,20%
Band 2: 0,20% to 0,60%
Band 3: > 0,60%
The advantages of the heatmap are:
- Works on all markets.
- Gives an uninterrupted impression of the size and strength of the market movements.
- The trader can set the bands based on his own preferences.
- Discreet position at the bottom of the charts.
- Allows the trader to scale his chart differently every day and still compare market movements.
1. MARKET MOVEMENTS
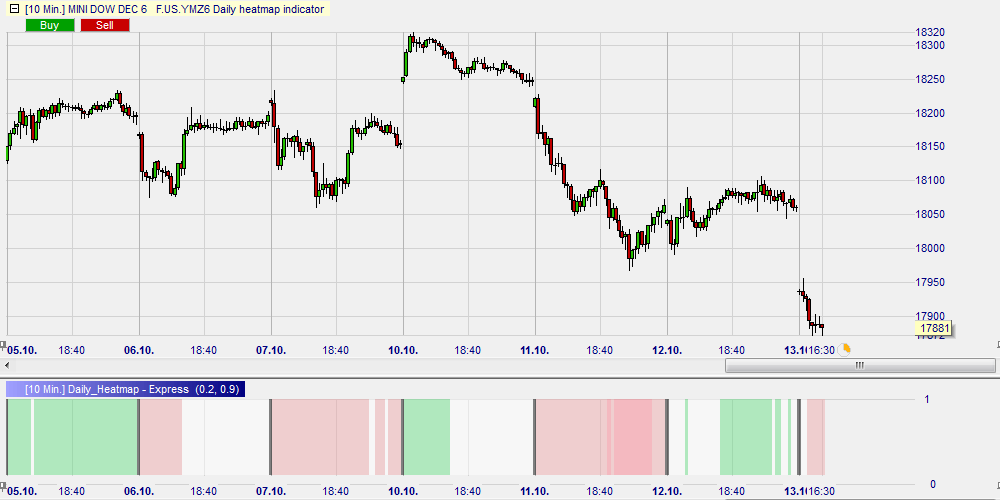
The heatmap, which can be added to the bottom of the chart, will show the first band as white, the second band as green (red) and the third band as dark green (dark red).
The colours give the trader a quick visual overview of the evolution and the size of the market movements.
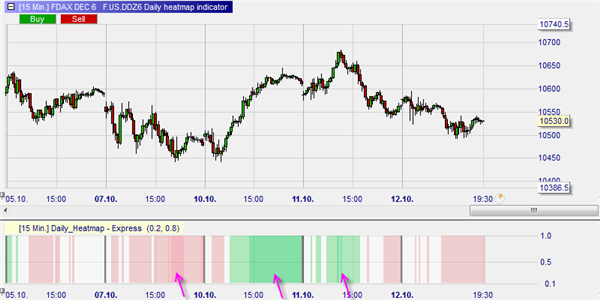
This example shows the DAX future over 5 days. The heatmap bands have been set to the values given as the example above. On only 3 occasions did the DAX future move more than 0,60%.
2. A CLASSIC ERROR REMEDIED
The heatmap also provides a solution to an error which many novice traders make. Traders have a tendency to adapt the height of their chart to the height of their PC screen. Concretely this means that when the market amplitude is small they increase the image by increasing the scale of the y-axis. When the amplitude of the market is big, they reduce the scale of the y-axis to fit the chart into screen. When all images have the same height, but a different y-axis scale, it is not possible for the trader to have a good impression of the relative amplitude of a market’s movement. The heatmap indicates the amplitude of the market movement, irrespective of the scale of the chart.
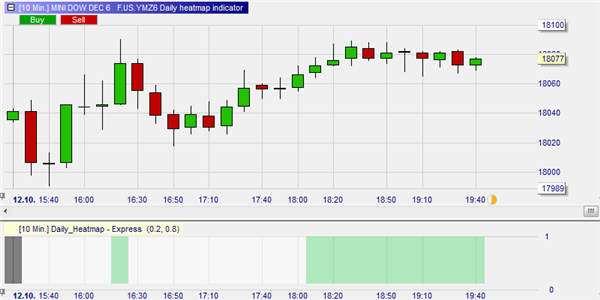
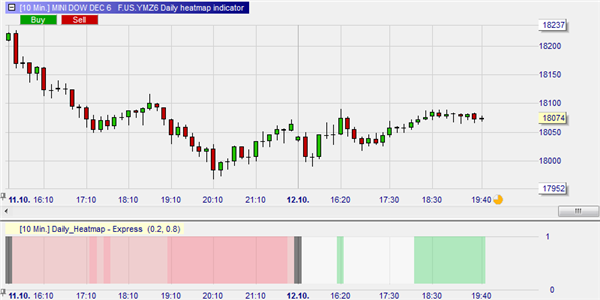
This example shows a 15-minute chart of the DOW future covering one day (note: the day is not yet finished). By fitting the chart to the screen, the initial candles look big. The heatmap, however, informs the trader that only on two occasions the DOW moves into the second band (0,20% - 0,60%), indicating a medium market move.
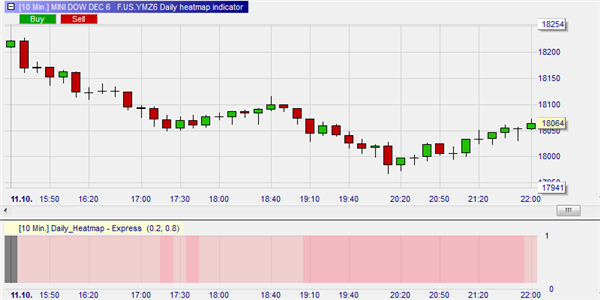
This example also shows a 15-minute chart of the DOW future covering one day. By fitting the chart to the screen the trader has the false impression that the market move is similar in size to the move in the previous example. The heatmap, however, informs the trader that from the opening the movement was bigger (no white, immediately into red). It also indicates that the market on three occasions moved more than 0,60% (dark red).
The two charts together on the same y-axis scale, making the differences in amplitude between the two days easily visible.
3. ALERTS
The trader can determine the three bands of the market heatmap. It is also possible to request alerts (e-mail, pop-up, sound) based on the bands.
Free demo

Trading videos
Charting, strategies, automated trading, backtesting, playback... watch these videos and become a platform master.

Broker
WH SelfInvest serves traders from offices in Germany, France, Switzerland, Belgium, Luxemburg and the Netherlands.
The spectacular SignalRadar
SignalRadar shows live trades being executed by various trading strategies.
More ...
- 1 of 5
- next ›