Test NanoTrader Full I Test Tradingview I Test the mobile platforms All for CFD-Forex & Futures
You are here
The support and resistance Sniper
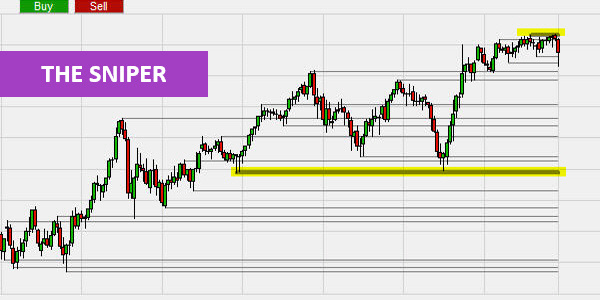
Support and resistance are essential trading concepts. Every trader should keep an eye on them. Support and resistance are simple concepts. In reality, there is a bit more to it than simply drawing horizontal lines where the market price used to trade frequently.
The SupRes Sniper provides an answer to these three questions...
- How to correctly identify support and resistance?
- Which are the most important support and resistance levels?
- How to trade successfully on the basis of support and resistance lines.
These are the benefits of the Sniper:
- Support and resistance are drawn automatically.
- The most important lines are clearly indicated.
- The Sniper can be used in all timeframes and for all instruments.
- The implementation is user-friendly. The interpretation is simple.
The Sniper is part of the NanoTrader trading platform:
Focus on key support and resistance levels
A support line, is a price level where the market traded often, but continuously struggled to break below. A resistance line, is a price level where the market has traded often, but continuously struggled to break above.
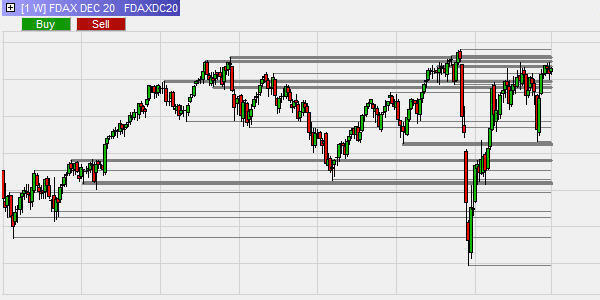
At some of these key price levels more trades occur than at other price levels. These support and & resistance lines at which more trades occurred are drawn thicker in the chart (note: four thicknesses are available). In short: the thicker the line, the more trades occurred at this price level, the stronger the support or the resistance was.
This example shows the automated SupRes Sniper on a weekly DAX chart. The lines where more trades occurred compared to the other lines, are thicker. This indicates the higher importance of those levels.
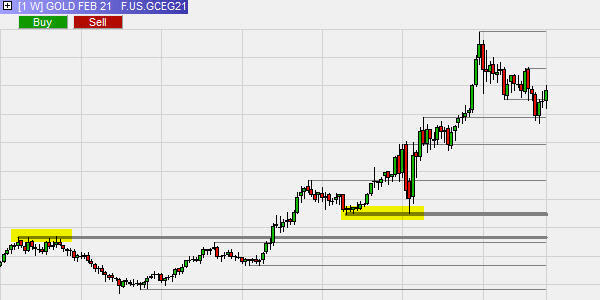
In addition, the SupRes Sniper has a unique mechanism that prevents too many lines from being drawn in the chart. The user can specify that all individual lines that occur within a certain price range are combined as a single line. This can be achieved with the parameter "Line precision" in the Designer Dialog.
This example the precision parameter is set to 20 ticks. This means that all lines detected in a price range of 20 ticks are shown as a single line. The two most resistance and support levels are clearly visible. This image is very clear.
This example shows the SupRes Sniper on a day chart of the Dow market index. One clear support and resistance level are visible.
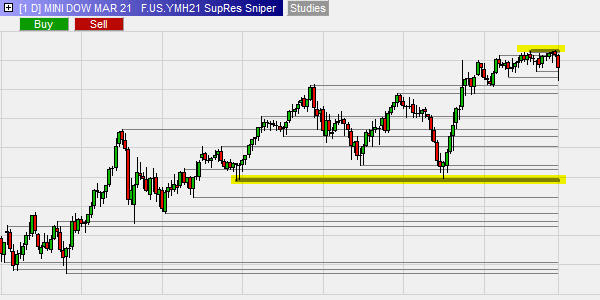
Important: The quality of support and resistance lines grows exponentially with the time frame. Even if you trade in lower time frames, it is strongly advised to use support & resistance levels based on at least a 60-minute chart or, even better, day charts or week charts.
People also read
Scalping trading ranges with the new Sniper
Free demo

Trading videos
Charting, strategies, automated trading, backtesting, playback... watch these videos and become a platform master.

Broker
WH SelfInvest serves traders from offices in Germany, France, Switzerland, Belgium, Luxemburg and the Netherlands.
The spectacular SignalRadar
SignalRadar shows live trades being executed by various trading strategies.
More ...
- ‹ previous
- 2 of 5
- next ›