Test NanoTrader Full I Test Tradingview I Test the mobile platforms All for CFD-Forex & Futures
You are here
The S&P 500 Night Rider Trading-Strategy
It is a proven fact that the largest market movements usually take place after the market closes. Most experts attribute this to the fact that market liquidity is low, which means that large post-market orders have a significant impact on the price. So when the stock market is in a steady uptrend, larger overnight price gains are bound to occur. The same is true for losses. When the stock market enters a bear market, the biggest losses occur overnight. And this is where the S&P 500 Night Rider strategy comes into play, helping the trader to profit from these overnight gains.
Advantages of the S&P 500 Night Rider Strategy:
- Easy identification of the prevailing upward or downward trends thanks to the green and red background shading
- Traders can use the AutoOrder function of NanoTrader to trade automatically
What is the S&P 500 Night Rider Trading-Strategy?
The S&P 500 Night Rider strategy is a trading strategy that trades after the market closes in the US - around 22:00 GMT. Domenik Maier developed this strategy to profit from price spikes caused by large orders, mostly from institutional traders, when market liquidity is lower after the close.
Typically, after-hours trading is conducted through electronic communication networks (ECNs). They automatically bring buyers and sellers together without the need to involve the stock exchange.
How to use the S&P 500 Night Rider strategy
There are two ways to trade the S&P 500 Night Rider strategy in NanoTrader - manually or via the AutoOrder feature, which trades automatically when bullish or bearish signals occur.
When should you open a buy trade?
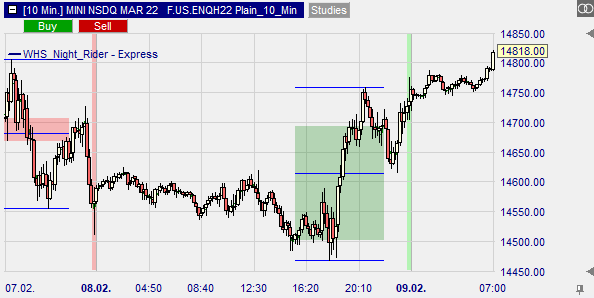
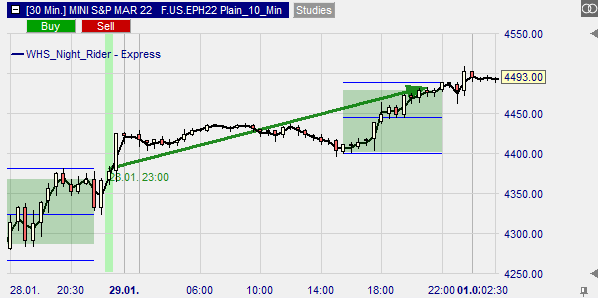
For the S&P 500 Night Rider strategy to trigger a buy signal, the market must be in an uptrend for long stretches of the day. This is the case when the asset price has risen above the 50-day MA. If this is the case, you will see a green shading on your chart.
The confirmation of the bullish signal occurs after the occurrence of a certain chart pattern in the previous two days.
- on the 1st day between 15:30 and 22:00 the daily candle must close within the lower half of the price range of that day
- on the 2nd day between 15.30 - 22.00 the daily candle must close above the upper third of the price range of the day
- the bullish signal occurs when the daily candle on the 3rd day goes 1 tick above the high of the 2nd day. This is marked by a green vertical line, as shown below
When should you open a short trade?
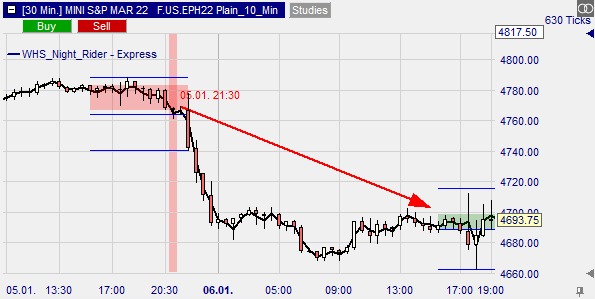
The sell signal for the S&P 500 Night Rider Strategy occurs when the asset has been trading below the 50-day MA for most of the day. When this is the case, you will see a red shading on the chart.
Confirmation for the sell signal occurs after a series of specific chart patterns have occurred over the previous two days.
- on the 1st day, the daily candle must close within the upper half of the price range of the day
- on the 2nd day, the daily candle must close below the lower half of the price range of the day
The bearish signal occurs when the daily candle on day 3 closes one tick below the lowest price reached on day 2. This is marked by a red vertical line as shown below.
Note that the S&P 500 Night Rider strategy closes a position using the normal TP and SL and a flat filter. Normally, the flat filter function closes the position before day 3 ends.
Conclusions
The S&P 500 Night Rider strategy available in the NanoTrader platform takes advantage of the significantly larger price changes in after-hours trading due to the lower trading volume. For semi-automatic trading, the trader can activate TradeGuard and AutoOrder, while activating the AutoOrder function enables full automatic trading.
People also read these trading articles
Free demo

Trading videos
Charting, strategies, automated trading, backtesting, playback... watch these videos and become a platform master.

Broker
WH SelfInvest serves traders from offices in Germany, France, Switzerland, Belgium, Luxemburg and the Netherlands.
The spectacular SignalRadar
SignalRadar shows live trades being executed by various trading strategies.
More ...
- ‹ previous
- 2 of 5
- next ›