Test NanoTrader Full I Test Tradingview I Test the mobile platforms All for CFD-Forex & Futures
You are here
The 1-Minute Breaks trading strategy
The 1-Minute Breaks trading-strategy is a very fast trading strategy that generates many signals. This is typical for a strategy in the 1-minute time unit. The signals are filtered using the Super Trend indicator and volatility. Nevertheless, the trader must to a certain extent co-determine and judge for himself which signals he wants to apply.
Advantages of the 1-Minute Breaks trading-strategy:
- It is well suited for all instruments
- Forms the perfect basis for the further development of your own 1-Minute Trading-Strategy
- Generates many signals and opportunities for trades throughout the day
The strategy in detail
The 1-Minute Breaks trading-strategy is suitable for all instruments and is traded in a 1-minute chart.
Should I trade?
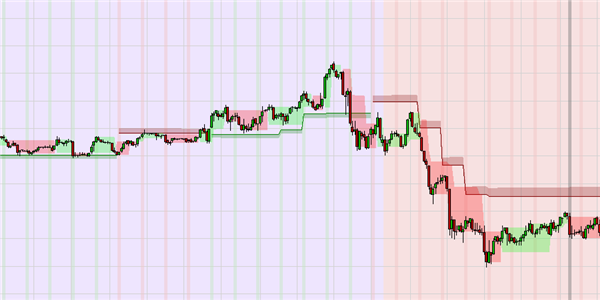
Traders should only trade when there is sufficient volatility. The 1-Minute Breaks strategy uses the Average True Range indicator (ATR) to inform you if there is enough volatility. If the volatility is too low, the chart background will be colored purple.
This example shows a chart background that is first colored purple (volatility too low to trade) and then red (trading is possible).
Should I buy or sell short?
Traders should only trade in the trend direction. The strategy uses the Supertrend indicator to determine the trend. The Supertrend is calculated over the 10-minute time unit. A unique feature in NanoTrader allows to use this aggregated indicator directly in the 1-minute main chart.
If the trend is positive (bullish), the chart background is green and only buy signals are generated. If the trend is negative (bearish), the chart background is red and only short sell signals are generated.
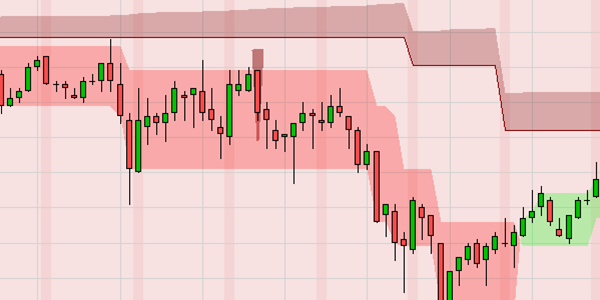
The following example shows the super trend band in the main chart. The trend, which is calculated on a 10-minute basis, is first positive, then negative and finally positive again. The chart background is colored accordingly.
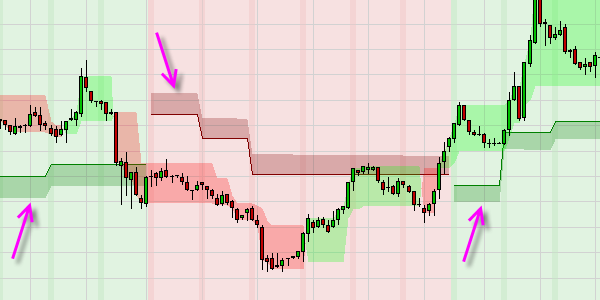
Interesting: The super trend is displayed as a band. This is a useful additional feature of this strategy. The height of the band changes as the volatility rises or falls. This is an interesting information for the trader. It is better to consider signals only when volatility is rising.
When is a position opened?
The 1-Minute Breaks strategy generates three types of signals.
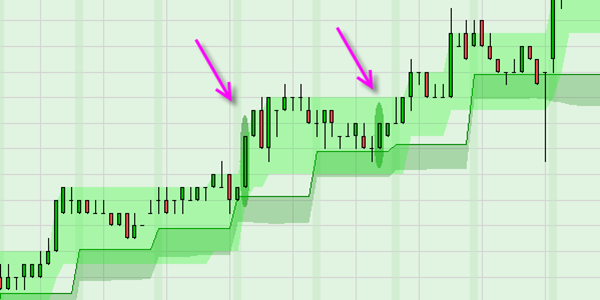
The first type of signal is the initial signal. These signals appear when the market breaks out of the colored three-line break bands. The initial signals are highlighted on the chart with a gray background.
This example shows three initial buy signals. Initial buy signals appear when the market closes above the red band.
The next example shows two initial short sell signals. Initial short sell signals appear when the market closes below the green band.
The second type of signal is the continuation signal. (Continuation). Continuation signals appear when the market breaks out of the three-line break bands in the trend direction. If the signals appear after an initial signal, the continuation signals can be considered as confirmation. Some traders wait for the first continuation signal after the initial signal before opening their position.
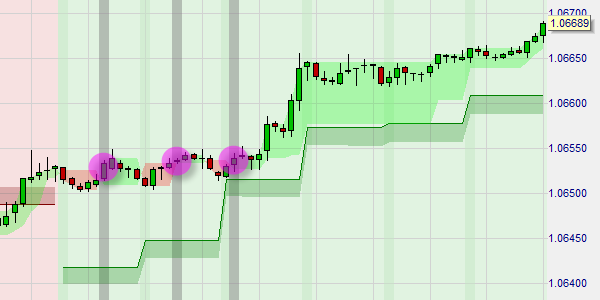
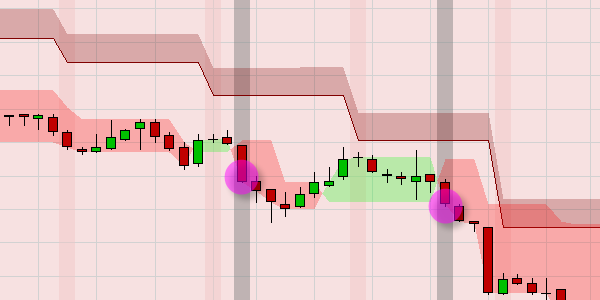
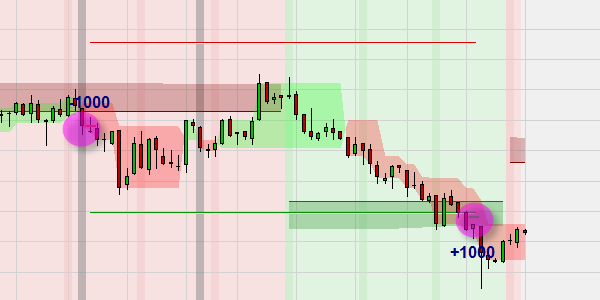
The third type of signal is the Supertrend Band signal. The Supertrend Band signals appear when the market closes within the Supertrend Band. The Supertrend Band signals are visualized in the chart by a green or red ellipse.
This example shows two super trend band buy signals.
The fourth signal is the ThreeLineBreak Bounce signal. The ThreeLineBreak Bounce signals occur when the market bounces off the bottom of the horizontal ThreeLineBreak channel (buy signal) or off the top of the horizontal ThreeLineBreak channel (short sell signal). The ThreeLineBreak bounce signals are represented by a green or red triangle on the chart.
The following example shows a ThreeLineBreak Bounce Short Sell signal after the market price has turned at the upper edge of the horizontal ThreeLineBreak Range.
When will the position be closed?
The 1-Minute Breaks trading-strategy uses a profit target and a stoploss. When you activate TradeGuard, these two orders are placed automatically. Both the profit target and the stop are placed with 3 times the ATR distance. The placed orders can be touched in the chart with the mouse and moved to other price levels by drag-and-drop.
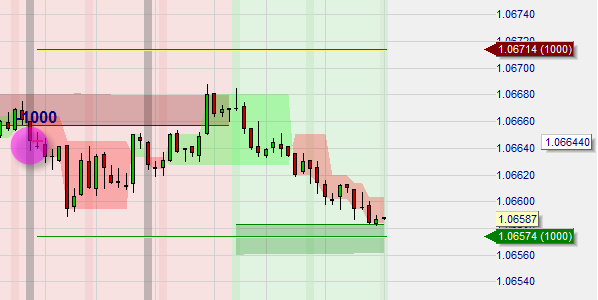
The provided example shows an initial short sell signal which is also a super trend band signal. The trader opens a short sell position. A second initial signal appears a little later. The red line is the stop order. The green line is the profit target. The market price is not far from the profit target.
This example shows the same trade as in the example above. The profit target was reached and the position closed with a profit.
Conclusion
The 1-Minute Breaks strategy is suitable for all instruments. The strategy generates many signals during the day. Traders have to co-determine which signals to trade. Signals appear only in trend direction and only when volatility is high enough.
This trading-strategy is also a very good starting point for traders who would like to develop their own 1-minute trading strategy. There are several ways to expand this strategy further.
People also read these trading articles
Free demo

Trading videos
Charting, strategies, automated trading, backtesting, playback... watch these videos and become a platform master.

Broker
WH SelfInvest serves traders from offices in Germany, France, Switzerland, Belgium, Luxemburg and the Netherlands.
The spectacular SignalRadar
SignalRadar shows live trades being executed by various trading strategies.
More ...
- 1 of 5
- next ›