Test NanoTrader Full I Test Tradingview I Test the mobile platforms All for CFD-Forex & Futures
You are here
Rob Hoffman's Inventory Retracement trades
An award-winning trading approach. Developed and used by Rob Hoffman, the Inventory Retracement Bar (IRB) strategy was originally used to win trading competitions around the world. The approach has since become one of the most popular ways to identify where a short-term counter-trend stock of institutional investors has dried up. Then it's time to trade back into the original trend direction. We show you how to identify when the conditions are right to execute the trade and how to set the entries and exits.
The Inventory Retracement Bar strategy
What is an Inventory Retracemen trade?
The inventory retracement trade is a strategy that enables the investor to identify specific institutional trader activity that runs counter to the current prevailing trend. This strategy allows you to identify entries when short-term counter-trend activity stops and the market is likely ready to resume its original trend.
There is a common myth among investors that institutions move like wolves in packs. But the reality is different. After all, the institutional investment business is fiercely competitive, and the firms concerned are primarily concerned with themselves - i.e. their own goals and performance metrics - in order to appear as attractive as possible to potential investors.
The strategy presented here is now to determine when one or a handful of institutions take stock out of the market or dump it on the market and deviate from the current market direction, causing a short-term retracement against the trend. We then look to see if the market in question resumes its previous trend when those short-term counter-trend institutional activities have ceased - i.e. when their stock positions have been or will be liquidated accordingly.
Free e-books for our readers...
How to identify an IRB
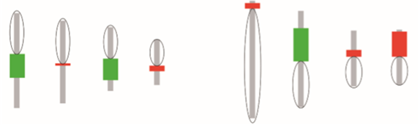
In an uptrend, look for candles that open and close 45 per cent or more from their highs in terms of their daily range. Conversely, in a downtrend, look for candlestick bars that open and close 45 per cent or more from their low in terms of their daily range. These are inventory retracement bars (IRBs, see examples in Figure 1).
Illustration 1 shows four individual examples of IRBs in an uptrend and four further individual examples in a downtrend. Shown in each case are candles that open and close 45 per cent or more away from their high in terms of their daily range (in an uptrend, see examples on the left) and vice versa (in a downtrend, see examples on the right).
On the left, downward pressure in a bullish market. On the right, buyers stepping in, during a bearish market.
Determining the trend
A simple approach to trend identification is to look at the 20-day exponential moving average (EMA 20) and ask yourself if it is at about a 45 degree angle, based on the time frame you want to trade. The next time frame above the one you want to trade should move in the same direction.
For example, if you are trading a 5-minute chart and it is in an uptrend, you would like your 15-minute chart to also be in an uptrend. If it is a sideways trend at the higher time level, or worse, a trend in the opposite direction, there is a higher probability that your trade will not be successful.
The entry strategy
Once an IRB and a real trend are identified, the next step is to keep watching the market. In a downtrend, wait for the price to break one tick or one cent below the low of the IRB.
In an uptrend, look for the market to break one tick/cent above the high of the IRB. Preferably, but not necessarily, the price should then break above or below the IRB sustainably within the next 20 bars, again based on the period you are trading. For example, if you are trading a 2-minute chart, ideally you would like to see the actual breakout in the next 40 minutes.
The exit strategy with a trailing stop
Many traders use price targets, but the preferred method here, which is more oriented towards support and resistance, is based on a trailing stop. This ensures that you do not have to give back profits in the wake of setbacks to the detriment of your position.
Typically, it is advisable to set a trailing stop for profits made in such a way that you hedge 50 per cent of the book profit. Only when the price approaches an important support or resistance level should you increase the stop to 90 per cent of the book profit. Important levels include the major Fibonacci marks, previous day highs and lows, daily, weekly and monthly pivot points and so on. If you want to feel as comfortable as possible with this strategy, you should preferably use the support and resistance levels that are favoured by yourself.
Managing the stop
Based on this trading strategy, after entry, there is an expectation that the market will continue to move in the original direction after experiencing a short-lived setback against the trend triggered by institutional investors. Often, once the IRBs have been broken, the market will rapidly accelerate in the wake of rapid market action and larger ranges, as all market participants slowly become aware that the brief setback was merely an interruption of the previous move and that the market has effectively caught up with itself again.
So once a trade has been entered, the price should not correct back beyond the opposite side of the IRB. For example, if the trade is entered in a downtrend one tick/cent below the low of the IRB, the price should not reverse back to one tick/cent above the high of that IRB. Otherwise, the market may form a more pronounced reversal pattern. Should this reversal occur, you should exit the position at a loss.
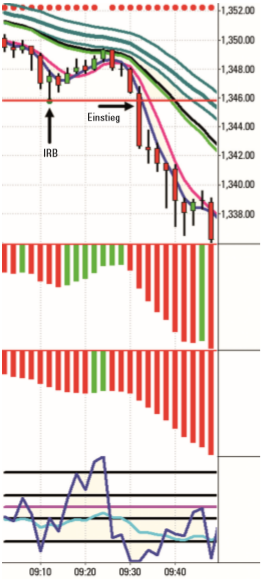
Illustration 2 shows an example trade in a downtrend. The black vertical arrow marks the Inventory Retracement Bar (IRB). The black horizontal arrow shows the entry into the short trade a little later, when the price breaks through the low of the IRB to the downside.
When not to use Rob Hoffman's strategy
This strategy is primarily designed to identify and profit from trend continuations after a counter-trend. Therefore, this trade is not recommended under the conditions of a sideways moving market, as then such a continuation often fails to materialise.
Why this strategy works
In general, the market tends to be directional, and from experience with as few private traders as possible who are in on the move in the right direction. In an uptrend, they are most likely to commit the following three things:
- Buyers get distracted from entering long trades when they see resets from previous highs that scare them into thinking the move is over.
- In the wake of setbacks, sellers give in to the false hope that all the short trades they had previously entered during an uptrend are finally starting to work.
- Buyers who bought during rapid widespread price rises in the hope of an even greater high at the high are stopped out during the setback.
Based on these three effects, once an IRB appears on the upside and is pierced, the market is more likely to move higher without all those aforementioned traders being on the right side of the market.
The German consumer organization consistently awards the NanoTrader trading platform a top score..
- Overall score: 5 out of 5 stars, grade: very good.
- Order execution: 5 out of 5 stars. Grade: very good.
- Trading platform: 5 out of 5 stars. Grade: very good.
- Mobile trading: 5 out of 5 stars. Grade: very good.
- Customer service: 5 out of 5 stars. Grade: very good.
- Order options: 5 out of 5 stars. Grade: very good.
Similarly, in a downtrend you can expect the following three things to happen:
- Sellers are distracted from entering short trades when they see resets from previous lows that scare them into thinking the move is over.
- In the wake of setbacks, buyers give in to the false hope that all the long trades they had previously entered in a downtrend are finally starting to work.
- Sellers who sold during a rapid widespread price decline in anticipation of a further decline at the low are stopped out during the reset.
Based on these three effects, once an IRB appears to the downside and is pierced, the market is more likely to move further down without all those aforementioned traders being on the right side of the market.
Important points you should take to heart
No IRB is given more weight because its closing price is above or below the opening price (that is, it does not matter whether it is a green or red candle).
Also, remember the concept of overextension. If the IRB has an exceptionally high range relative to the Average True Range (ATR) of the last 10+ bars, there is a higher probability that the re-break of the IRB will fail. This then tends to lead to an unfavourable entry, which is more likely to mean a reversion to the mean, as most of the momentum has been squandered and the profit opportunity largely lost after the large range has been covered to the other side of the IRB. So in this case the trader is left with little profit potential and a large gap to stop, which is obviously not an optimal setup.
Use a proven technical analysis tool to identify good trends. If you have no concrete idea what to use, trade towards an EMA 20 with an angle of about 45 degrees.
This strategy has multiple applications across all markets and asset classes. In addition to trading conventional stocks, futures and forex instruments, traders can, for example, also consider using this strategy to analyse stocks and then trade them with options. In-the-money options with a high delta are particularly suitable as an idea for active traders.
Conclusion
We have shown you here a simple, award-winning strategy that you can "take home" and explore. It gives you an excellent tool to help you identify where other traders are misjudging market movements. It shows where institutions are temporarily straying from the trend because they are making short-term additions to the stock or liquidating holdings. Once these transactions stop, the overall market can resume the overriding trend - giving traders the opportunity to trade back in the direction of the overall trend.
People also read
- The Larry Williams Proxy Index trading strategy
- Trading based on the Parabolic SAR indicator
- Free trading strategies
“If you have a losing position that is making you uncomfortable, the solution is very simple: Get out, because you can always get back in. There is nothing better than a fresh start.”
- Trader Paul Tudor Jones
Free demo

Trading videos
Charting, strategies, automated trading, backtesting, playback... watch these videos and become a platform master.

Broker
WH SelfInvest serves traders from offices in Germany, France, Switzerland, Belgium, Luxemburg and the Netherlands.
The spectacular SignalRadar
SignalRadar shows live trades being executed by various trading strategies.
More ...
- 1 of 5
- next ›