Test NanoTrader Full I Test Tradingview I Test the mobile platforms All for CFD-Forex & Futures
You are here
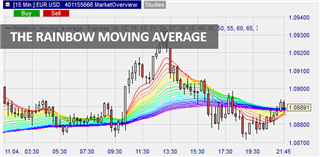
The Rainbow Moving Average
Moving averages are undoubtedly one of the most popular technical indicators for traders. Their popularity is mainly due to their simplicity and accuracy, which is why several other indicators have been developed based on the moving average. One such indicator is the Rainbow Moving Average.
Advantages of the Rainbow Moving Average:
- It is easy to visualize the general market trend
- It simplifies the entry and stop-loss targets
- Higher accuracy, since EMAs with different periods are used
- Easy detection of trend reversals after a prolonged bull or bear trend
What is the Rainbow Moving Average?
The Rainbow Moving Average is a single indicator with 22 exponential moving averages (EMAs) with different periods - from a 9 period EMA to a 100 period EMA. Each EMA has a different color, which all together look like a rainbow on the chart, hence the name Rainbow Moving Average.
How does the Rainbow Moving Average work?
Since it is based on the EMA, the Rainbow Moving Average is primarily designed to detect trend changes, which is particularly useful in determining the optimal entry and exit. The Rainbow Moving Average consists of 22 EMAs of different periods, with the individual EMAs overlapping. The top and bottom of the rainbow provide dynamic support and resistance levels over time. This means that the easiest way to trade the Rainbow MA indicator is to trade the breakouts, in this case when the price crosses above or below the Rainbow.
Remember that when calculating the EMA, usually the recent price changes are weighted more heavily. If the price rises faster than all the EMAs of the Rainbow moving average, then we have an uptrend. Conversely, if the price falls faster than all 22 EMAs, the trend is down.
Note that the Rainbow moving average works best in a trending market, and you should avoid trading it when the market is trending sideways. In this case, the indicator is prone to false breakouts.
Rocognition of buy signals
With the Rainbow moving average, an uptrend occurs when the asset's price rises above the Rainbow. However, a buy signal is generated when the price breaks above the Rainbow and the next candle opens above it. Note that the Rainbow must be in a rising pattern, indicating that the market is in a strong upward momentum.
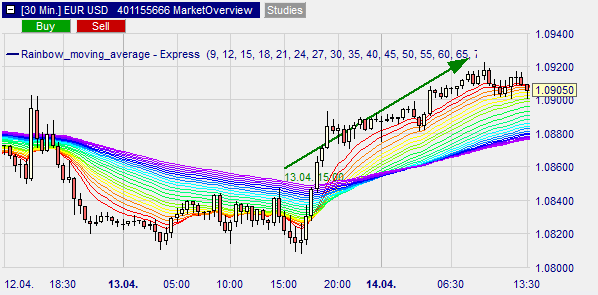
Since this is a breakout strategy, the stop loss is set immediately below the opening of the previous candle, just below the top EMA in the rainbow.
Recognition of sell signals
In a strong downtrend, the Rainbow Moving Average is in a steep downtrend and the short sell signal is generated when the price falls below the lowest EMA in the Rainbow. However, the best entry for a short trade is when the asset closes below the Rainbow and the following candle opens below it.
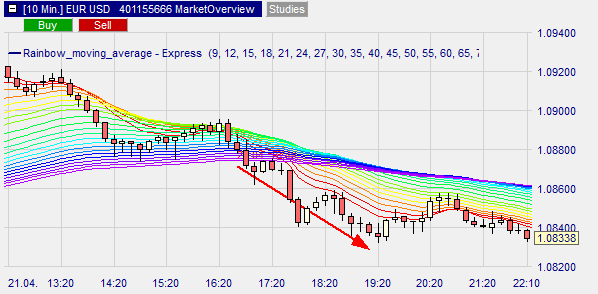
Ideally, your stop loss should be immediately above the opening of the previous candle, which is just above the lowest EMA in the rainbow.
Conclusion
The Rainbow Moving Average is one of the most versatile trend indicators. Since it consists of 22 EMAs ranging from the 9-period to the 100-period, it is the ideal indicator to identify and trade breakouts from dynamic supports and resistances. When the price of an asset is above the rainbow, it usually signals an entry to the upside, while an entry to the downside occurs when the price falls below the rainbow.
People also read these trading articles
Free demo

Trading videos
Charting, strategies, automated trading, backtesting, playback... watch these videos and become a platform master.

Broker
WH SelfInvest serves traders from offices in Germany, France, Switzerland, Belgium, Luxemburg and the Netherlands.
The spectacular SignalRadar
SignalRadar shows live trades being executed by various trading strategies.
More ...
- ‹ previous
- 2 of 5
- next ›