Test NanoTrader Full I Test Tradingview I Test the mobile platforms All for CFD-Forex & Futures
You are here
John F. Carter: How to trade momentum after calm market phases
In this fantastic interview with trader John F. Carter, he explains the way he trades on his own, and describes some of his favourite trading set-ups. Trader and fund manager John F. Carter is also the author of the bestseller book "Mastering the trade". In his book he describes valuable techniques for trading intraday setups. Some of John F. Carter's strategies have been included in NanoTrader. Try the free demo...
John F. Carter explains two trading strategies
Trader and fund manager John F. Carter is the author of the book "Mastering the trade". He describes valuable techniques for trading intraday setups. Some of John F. Carter's strategies have been included in NanoTrader.
Could you explain the details of your box approach?
Gladly. One lesson that every trader learns pretty quickly is the fact, that markets never go in a straight line up or down - at least not forever. A market may run up for quite a while, but at some point, it will have to pause to consolidate. In some cases, the price will directly turn around and give back all the gains. Similar to a runner who can only sprint for a limited amount of time before his body gives up, the market can also only hold at a certain price level for so long before it runs out of steam and needs a break to recharge its batteries for the next move.
In my box trades, I look for a market that is taking a break and is short before the next move. While searching for this move, I want to see a horizontal consolidation on the chart with at least two tests of the highs and lows. As soon as I recognize this constellation in the chart, I buy the bullish breakout from the box and sell the bearish breakout. My price target is derived from the range of the box. This approach can be done on all time levels, but I prefer the 5-minute and 15-minute charts for day trading. Swing traders, it is well advised to use the 60-minute and daily charts. I trade both variants independently of the time levels. That is, I could have a 60-minute box trade open and at the same time a 5-minute trade in the opposite direction. Since the euro is traded around the clock, these strategies can be used at any time.
What are the rules for this setup?
For long entries, the following rules apply (for shorts, the opposite is true):
1. I use a 24-hour chart so that overnight movements are reflected in the indicator.
2. I like to use a simple bar chart without any indicators or other unnecessary stuff, choosing the period setting I want to trade. I search for places in different time frames where box trade opportunities are just emerging.
3. Once the market starts consolidating, I wait for at least five consolidation bars and then mark a horizontal line on the chart connecting the highs and lows. I usually have to readjust this line a time or two as it progresses, but once I have two tests on one of these lines, I know a box trade is developing.
4. At that point, I watch for a retest of the opposite side of the box. Let's say that test occurs and both the low and high of the box have been tested twice each, with a range of 20 ticks.
5. Now that I have a complete box, I place two orders: a stop buy order with one tick above the box and a stop sell order with one tick below the box. Whichever way the market will go, I sit there waiting for one of my orders to be executed.
6. Let's say my buy order is executed. Now I place a sell limit at a distance of 20 ticks (this corresponds to the box width) from my entry. I leave the other order further in the system, as it represents my stop for the trade from now on. This corresponds to a risk/reward ratio of about 1:1. As soon as my price target (profit in the amount of the box size, in this case 20 ticks) is reached, I usually close out half of my position and move the stop for the rest of the position on the entry level. Then I control the last phase of the trade using various indicators. Mostly I take the momentum on the TTMSqueeze indicato. The TTM Squeeze indicator is a self-developed aggregation of other indicators and can be purchased. If the momentum starts to turn, I sell the rest of the position.
7. I stay invested until either my stop or my price target is reached. Even if I tighten my stop after reaching the price target for half of the position, I don't use trailing stops afterwards, I just wait until the momentum decreases and only then get out.
Could you show us some examples of this strategy?
Figure 1 shows a daily chart of the EUR/USD. This chart is meant to serve as an example of a swing trade while demonstrating the "power" of the box. Between April 28 and May 4, 2011, the market lost strength and began consolidating the previous rise (point 1). At such points, I wait for at least five consolidation bars and look for a possible sideways zone (box) characterized by several highs and lows not too far from each other. If these five consolidation bars are visible in the chart, I start measuring the high and low points. In this case, the high is at 1.4939, while the low was formed at 1.4754. Thus, the gap is 185 pips. I place a stop buy order a few ticks above the top of the box and a stop sell order a few ticks below the bottom of the box. Then I lean back and just wait to see which direction the market decides to go. If it goes up and breaks out of the consolidation zone, my buy is activated. If, on the other hand, the consolidation zone is exited to the downside, I am in with my short position.
Figure 1. Box Play EUR/USD Daily Chart. Figure 1 shows a consolidation box of five bars (point 1). We place a stop buy order a few pips above the top of the box and a stop sell order a few ticks below the bottom of the box. As the market breaks out to the downside, a short trade is triggered. At point 2, our first price target is reached. As soon as the momentum - recognizable by the TTM Squeeze indicator - turns, we close out the position (point 3).
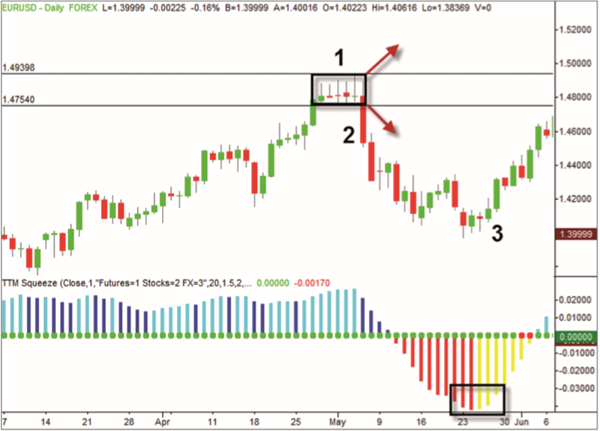
In this example, the momentum is resolved downwards and at point 2 my first price target of 185 ticks is reached, so that half of the position is closed out. At the same time, I tighten my stop for the remaining half of the position to the entry level and let the trade continue as long as there is no reversal in momentum. At point 3, the time has come: the momentum, which has been steadily increasing up to now, starts to move in the opposite direction. The profit of the second half of the position is almost 600 pips. The majority of traders who used a trailing stop may have been stopped out after the four-day upward correction from May 16-19, 2011.
This is a swing trade and the rebound, which lasts several days or even weeks, must be factored in. Unfortunately, many people simply do not bring enough patience to wait. But it is exactly this patience that needs to be learned. In fact, it is often best to simply do nothing at all. Put your hands on your lap and wait. For those traders who just can't manage to hold positions overnight, it's ok, because the same trade can be done on smaller time frames, for example on the 5 and 15 minute charts. Let's take a look at picture 2 for this purpose.
Figure 2. box play EUR/USD 15-minute chart. On June 22, 2011, the euro forms a box on the 15-minute chart (point 1). We place our stops just above and below the boundary lines of the box. A short trade occurs and our first price target is reached 30 minutes later (point 2). We get out as soon as the momentum changes direction (point 3).
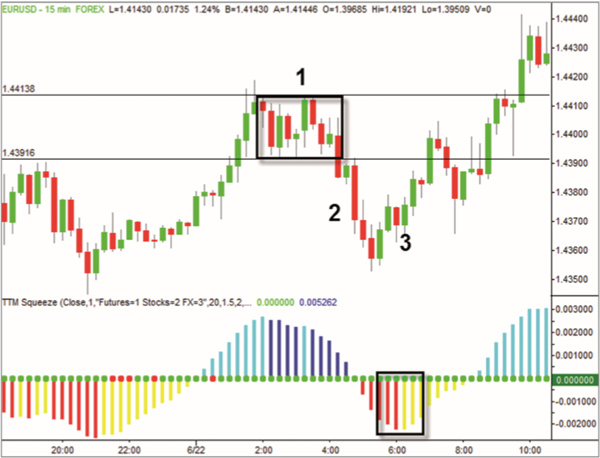
On June 22, 2011, the euro formed a box on the 15-minute chart (point 1). I again proceed as just described: I wait until at least five consolidation bars are generated and then draw the upper and lower limits of the box. I then place my stop orders just above and below the boundary lines of the box. The range in this example is 22 ticks, so my price target for the first half of the position is also 22 ticks. The denouement occurs on the short side, and about 30 minutes later (point 2) my first price target is reached. I then adjust my stop to the cost level and from now on I only watch the momentum. If its direction turns, I also exit with the second half of the position (point 3).
What are the details of your other approach, the squeeze strategy?
The squeeze approach is about jumping on the train at the exact moment, when it leaves the station. This approach takes advantage of periods of sharply lower volatility, when the market gathers strength for the next dynamic move. Quiet market phases of this kind can be recognized by the fact that the width of the Bollinger bands narrows to such so strong that they are quoted within the Keltner channels. A trading signal occurs when the Bollinger bands break out of the Keltner channels again. A 12-period momentum oscillator shows me whether I should go long or short: If the oscillator is above the zero mark when the trading signal occurs, I go long; if it quotes below the zero mark, it's short. These are quite common tools that any commercially available trading software provides. I use the default settings in the parameters. In addition, I put everything together in one indicator to make it easier to see the signals.
Can you tell us about the exact rules for the squeeze approach?
On the long side, the rules are as follows (the reverse is true for the short side):
1. I use a 24-hour chart so that overnight movements are reflected in the indicator.
2. When there is a red dot, it's: Eyes and ears open. It is not yet a trading signal, but only information that a trading signal is building up.
3. The actual signal at the indicator is the first green dot, which follows a series of red dots. (The details of this are shown in Figures 3 and 4).
4. Once the first green dot appears after a series of red dots, I go long if the histogram is above zero. I do not use limit orders on purpose, but go directly into the market by market order. After all, it is a momentum trade and I do not want to expose myself to the "danger" of non-execution.
5. I set my stops based on the time period I am trading. For 5-minute charts I take a stop of 20 ticks, for 15-minute charts 25 ticks, for hourly charts 30 ticks, for daily charts 50 ticks. One pip corresponds to ten dollars (for standard lots) or one dollar (for mini lots).
6. My price target depends exclusively on the momentum of the price movement. As soon as the momentum signal starts to weaken and turns around, I exit the trade via market order.
7. I do not use trailing stops because I have learned that it is usually better to leave the trade alone than to constantly intervene.
Show us some actual charts of the trades you've made with the setup you've described
First, let's look at Figure 3. On June 29, 2011, there was a squeeze on the 15-minute chart (represented by the red dots at point 1). At point 2, the dots change from red to green, meaning a trading signal was triggered. Since the momentum is above the zero line, this is a long trade. So I enter at 1.4370 (point 3). This buy signal lasts until the momentum - shown as a histogram below the chart - loses strength (point 4). Two consecutive dark blue bars indicate a momentum loss. A bit earlier, a single dark blue bar could already be observed. If the following one was also dark blue, I would have already exited there. But since the momentum rose again (after the dark blue bar followed again a light blue bar), I stayed invested.
Figure 3: Squeeze Play EUR/USD 15-minute chart. The EUR/USD is in a squeeze (red dots at point 1). At point 2, the dots change from red to green, generating a trading signal. Since the momentum histogram is above the zero line, we open a long trade (point 3). We close the position when the momentum loses strength (two consecutive dark blue lines at point 4).
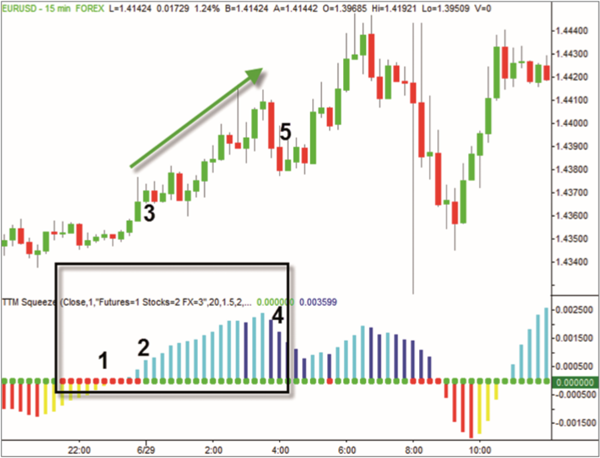
My exit was at 1.4388, which made a profit of 18 pips. Of course, it is possible to make the exit from the second half of the position in stages as long as the trade is going in the expected direction. Basically, you can use the squeeze approach in all time frames, although I prefer to be on the 60-minute and 120-minute charts. However, it is also important to understand what the signal looks like on the weekly chart, as this represents the overarching move.
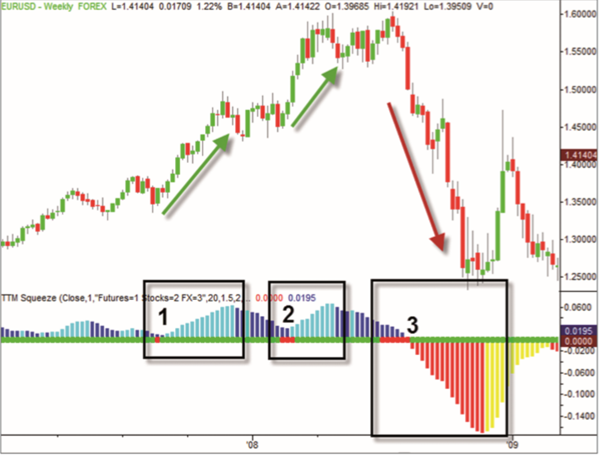
Looking at Figure 4, three squeezes in the weekly chart of the EUR/USD stand out. The first one took place on August 24, 2007 (point 1). At the time of the signal, the EUR/USD was at 1.3550. At the time of the momentum squeeze (indicated by two consecutive dark blue bars in the histogram), the currency pair was at 1.4560, a rise of about 1000 pips. On March 7, another trading signal occurred, which subsequently led to a rise in the euro from 1.4970 to 1.5528, a move of 556 pips (point 2). Finally, on August 15, 2008, the squeeze signalled a short entry, which was followed by a crash of the euro from 1.4750 to 1.3035 (1715 pips).
Figure 4. Squeeze Play EUR/USD Weekly Chart. This image shows three squeezes in the EUR/USD: the first is at 1.3550 (point 1). Until the momentum weakens, the EUR/USD makes an upward move of more than 1000 pips. After that, another trading signal occurs, leading to a 556 pip rise (point 2). The last squeeze signals a short trade, after which the EUR/USD falls by 1715 pips.
As you can see, all of these moves were big, and many traders simply don't have enough buffer to ride out the intervening moves. However, it is of tremendous importance to know whether or not there is a squeeze signal on the weekly chart in the markets you are trading - even if you are not trading the signal because the time unit is too high. Any trader who keeps this information in mind will not even think of fighting the trend. So even if you are primarily a day trader, if there is a long squeeze in the weekly chart, it is recommended to focus only on pullbacks and ignore all short signals. Even if such squeezes only occur a few times a year, they must not be ignored no matter what.
What is your typical daily routine?
My normal daily routine varies much more today than it used to because I have children. I am a passionate trader, but my children are in an important developmental phase. So every now and then I miss important market movements in the context of important economic data because I'm watching a play my kids are having at school or something similar. In a way, this has forced me to be more mechanical in some of my setups. I have also hired an assistant to help me execute trades. I usually sleep through the night and don't get up in the middle of the night to follow market developments. In the morning, I check the prices and charts of about ten key markets. I also briefly skim the news headlines. After that, I try to keep everything simple and wait until good opportunities present themselves in the market.
What advice can you give to novice traders?
Beginners should trade small positions and try to keep trading relatively simple. I truly believe that after six months of trading with one market, one indicator and one time unit, you will find a profitable setup that you can trade and make a living with.
Are there any major mistakes that even pro’s make over and over again?
The biggest mistakes I make often happen after a long winning series. So some of my setups are purely mechanical. They keep me from making classic mistakes, like getting cocky.
What are your views on the academic concepts of efficient markets and behavioural finance?
I believe that markets measure human fear and greed. When too many funds get too greedy, disaster ensues as everyone is forced to unwind their positions at the same time. The same game takes place with individual investors and traders. Therefore, the task of a trader is to focus on his risk and participate in the trends created by the mentioned factors for as long as possible.
What do you do in your free time?
In my free time, I love spending time with my three young children. I also own a horse ranch in the country where I like to go to relax and read. I would also like to participate in sports competitions in the future. This motivates me on to train and keeps my body healthy.
Can you think of any reasons you would stop trading?
Honestly, no. Because every day is different and the activity also stimulates you mentally. I do take breaks every now and then where I don't trade for a few weeks, but I can see myself staying involved with the markets for the rest of my life. Source: Traders' Mag.
People also read
“Every trader has strengths and weakness. Some are good holders of winners, but may hold their losers a little too long. Others may cut their winners a little short, but are quick to take their losses. As long as you stick to your own style, you get the good and bad in your own approach.”
- trader Michael Marcus
Free demo

Trading videos
Charting, strategies, automated trading, backtesting, playback... watch these videos and become a platform master.

Broker
WH SelfInvest serves traders from offices in Germany, France, Switzerland, Belgium, Luxemburg and the Netherlands.
The spectacular SignalRadar
SignalRadar shows live trades being executed by various trading strategies.
More ...
- ‹ previous
- 2 of 5
- next ›