Test NanoTrader Full I Test Tradingview I Test the mobile platforms All for CFD-Forex & Futures
You are here
Your own candlestick patterns
Every trader wonders if particular candlesticks patterns are ‘winners’. In order to determine if a particular pattern of his own design generates profits, the trader needs a tool which allows him to define and test candlestick patterns. The NanoTrader contains such a tool.
These are the advantages of this tool:
- You can define your own candlestick patterns without programming.
- You can also define combinations and sequences of candlestick patterns.
- You can use your permanent real-time papertrade account to test trade your patterns.
- You can backtest your patterns.
- You can combine your candlestick patterns with stops, trendlines …
- A position can be opened automatically if your pattern occurs.
- A position can be closed automatically if your pattern occurs.
- The tool is free and integrated in the NanoTrader.
- No programming is required.
1. DEFINING CANDLESTICK PATTERNS
All the parameters of a candlestick pattern can be defined by using numbers. Defining patterns is a simple process. It is not the objective to explain the definition process here, but practical examples are given.
Besides defining his candlestick pattern, the trader can also define many other elements such as the points in time during which the pattern needs to occur.
2. EXAMPLE – FOUR GREEN CANDLES
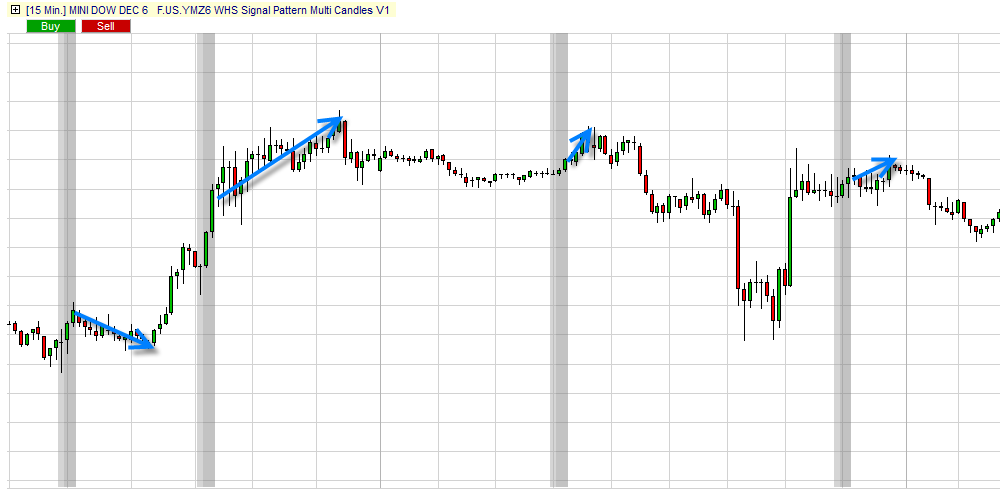
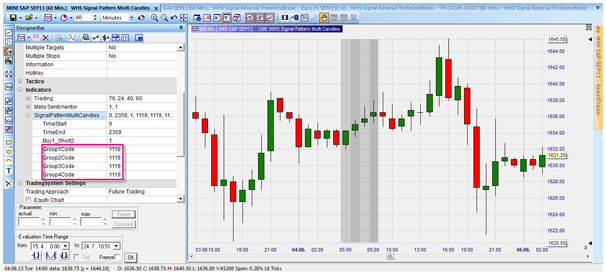
This trader wants to identify four successive green candles of about equal size. He defines four groups of one candle each. The direction of each group is upwards. Each group contains only one positive candle. This already defines the four number codes as 111x. The candles also need to be about the same size. Hence the codes become 1119.
To the left in the chart another succession of four green candles is visible. This pattern is not retained by the NanoTrader because the candles are not about equal in size.
3. EXAMPLE – A DOJI AND THREE POSITIVE CANDLES
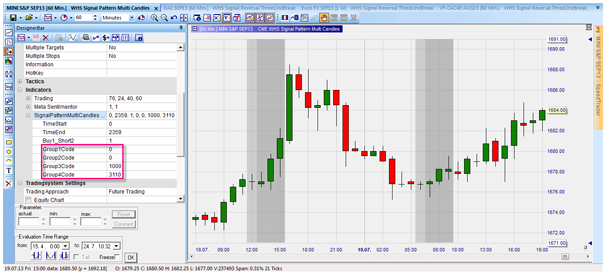
This trader wants to find a Doji candle followed by three positive candles. The Doji candle is a candle with no body. It is considered a candle which indicates a change in trend. This pattern allows the trader to see how often a Doji is indeed followed by three green (bearish) candles. Define two groups: one for the Doji and one for the three green candles. A Doji will, per definition, always have the code 100x. The codes for the two groups are 1000 and 3110.
4. EXAMPLE – FOUR REDS FOLLOWED BY TWO GREENS
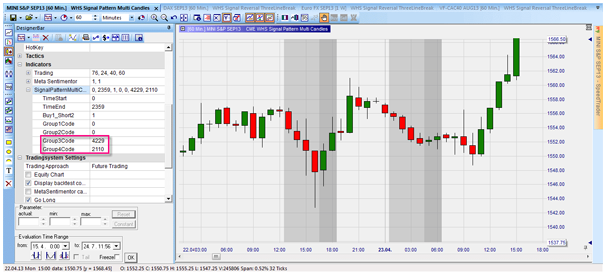
This trader wants to see all occurrences of four red candles followed by two green candles. Maybe more often than not a third green candle occurs after this pattern? Define two groups: one for the negative candles and one for the positive candles. If the relative height of the groups is not relevant, the codes are 4229 and 2110.
5. AUTOMATING ORDERS BASED ON CANDLESTICK PATTERNS
The trader can use his candlestick patterns to trigger orders. A position can, for example, be bought automatically when the pattern occurs. The trader can also use his patterns to manage an open position. When, for example, the trader has bought a position he can instruct NanoTrader to close the position when the candlestick pattern occurs. No programming skills are required.
Professional trader Kroum Petkov offers his risk management tool for free in NanoTrader.

Discover a new world... test the NanoTrader trading platform.
Free demo

Trading videos
Charting, strategies, automated trading, backtesting, playback... watch these videos and become a platform master.

Broker
WH SelfInvest serves traders from offices in Germany, France, Switzerland, Belgium, Luxemburg and the Netherlands.
The spectacular SignalRadar
SignalRadar shows live trades being executed by various trading strategies.
More ...
- ‹ previous
- 2 of 5
- next ›