Test NanoTrader Full I Test Tradingview I Test the mobile platforms All for CFD-Forex & Futures
You are here
Triangles are important in trading

Even in this day and age of alogorithmic trading, there are still valid trading strategies, which are (partly) based on visual chart patterns. We are talking about trend lines, trend channels, trend formations and triangles. Perhaps these simple principles have lost a bit of their shine, but they can certainly prove to be powerful instruments and generate great trading opportunities.
Especially if you like trading strategies with high hit rates, you should familiarise yourself with these fundamental technical analysis topics.
How to trade using (opposing) trends and triangles
Visualising a trend with the help of a trendline
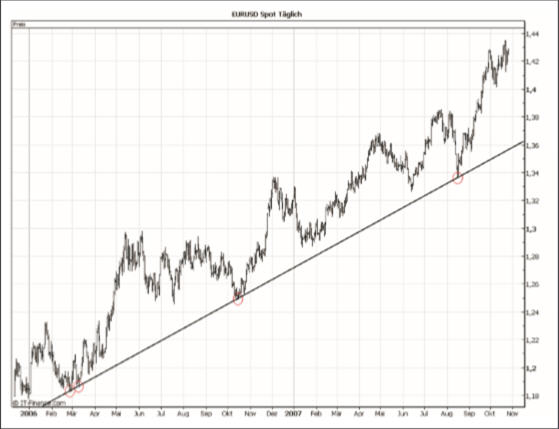
Let's start simple. Figure 1 shows a day chart of the EUR/USD forex pair. The relative lows are highlighted. By connecting these points you get a simple trend line. To draw a trend line, you always need at least two lows. If a third low forms in the further course, which then touches this line, i.e. does not pierce it, then the trend line is considered confirmed. You can see how exactly this line was confirmed in the middle of August.
Furthermore, it can easily be deduced from this line that the euro is rising steadily against the dollar. This is called an upward trend. This line currently runs at around 1.36 and only when the chart pierces this line downwards does the technical analyst assume that this visually apparent upward movement has come to an end for the time being. This phenomenon is referred to as a trendline break. Trendline breaks indicate trend reversals and are thus to be regarded as significant points in the chart.
Figure 1: EUR/USD on a daily basis (simple trend line). You can see the chart of EUR/USD over a period of just over two years with an upward trend line. The lows in the chart are marked to illustrate the concept of creating trend lines.
Channels, boxes and triangles
Just like the lows, the highs can be connected at the same time. If you use two trendlines in your chart analysis, you will realise that a variation of patterns can emerge in the process. Two parallel rising or falling trend lines are called an upward or downward trend channel. Two parallel horizontal trend lines are usually called a box. If the chart breaks out of such a pattern, this is interpreted as an entry signal. Therefore, only the case of opposing trend lines will be dealt with in the remainder of this article, as these inevitably lead to a break and thus to a signal. Opposite means: falling high points and rising low points. Such a pattern is called a triangle.
Find a triangle and you find a trading signal
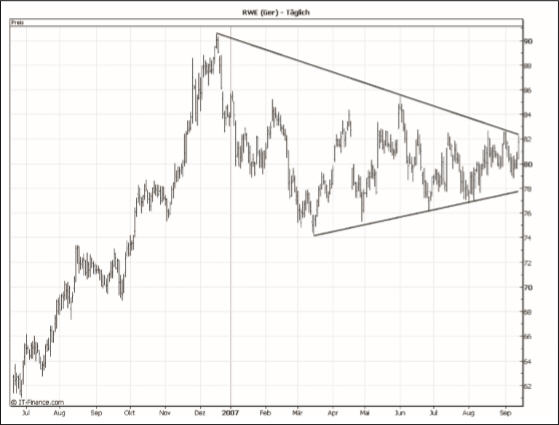
Since a breakout from a triangle formation is inevitable, much of your work now is to spot triangles. These can appear on any time frame - even intraday. It is advisable to consider a breakout as a signal only if the closing price of the current period is above or below the trend line to be broken. However, if this is the case, go long or short accordingly - depending on the direction of the break. A break from below to above through the falling trend line is a buy signal, a break from above to below through the rising trend line is a short sell signal. Look at Figure 2. You can see how a triangle has formed in the chart of this stock.
Figure 2. RWE stock on a day chart displays a triangle. As can be seen, the opposing trend lines developed more and more into a triangle from December to mid-September.
Determining a profit target and setting a stop loss
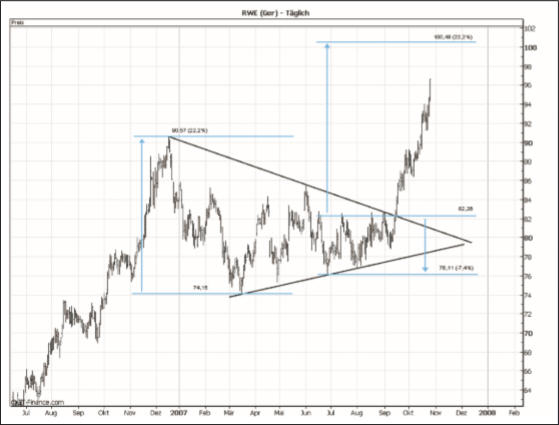
In addition to the setup and entry criteria, a solid strategy also requires a precise exit point. The exit can be found relatively simply using chart-technical criteria. The starting point for determining the profit target is the existing volatility, i.e. the fluctuation range of the prices. You measure this on the basis of the size of the triangle at the outermost point, i.e. the distance between the first extreme points. Once you have determined this distance as a percentage, project it vertically to the exact breakout point, i.e. exactly at the intersection of the chart and the trend line and not at your entry point.
For example, if the price of the first low of a triangle is 3.9 per cent below the price of the first high, in the event of an upward breakout from the triangle (long signal), assume that the price will gain at least 3.9 per cent measured at the breakout point.
Set a stop price at the same time as the entry. The distance of the stop price from the breakout point is one third of the triangle height. In the previous example, the stop price would be 1.3 percent below the breakout price. Figure 3 deals again with RWE and the price target and stop price have been added to the illustration.
Figure 3. RWE on a day chart. Once again, we look at the RWE chart. In the meantime, the triangle has broken out upwards and triggered a buy signal at 82.26. According to the regulations, one can set a target at 100.48 and a stop at 74.11 with the entry at this point.
If you set both exit prices in a disciplined manner, you will always achieve a risk-reward ratio greater than two to one, since you never hit the exact point of entry and certain expenses are incurred with each trade. However, always make sure that you set stops and that the risk-reward ratio is greater than two to one. Of course, you can also trade other visually recognisable chart patterns in this way, you can expand the entry criteria, trade several contracts differently or use a completely different exit technique. Be creative!
Conclusion
All in all, you will be able to make profits in the longer term, because the hit rate of this strategy is well over 50 percent, as the respective signals are considered to be relatively strong. With good risk and money management, you are always safe. The only drawback is that these triangles rarely occur and therefore, as already mentioned, the majority of the work when using this strategy is the effort of finding them. Quelle: Traders' Mag.
People also read
Recommended broker
"I know where I’m getting out before I get in."
- trader Bruce Kovner
Free demo

Trading videos
Charting, strategies, automated trading, backtesting, playback... watch these videos and become a platform master.

Broker
WH SelfInvest serves traders from offices in Germany, France, Switzerland, Belgium, Luxemburg and the Netherlands.
The spectacular SignalRadar
SignalRadar shows live trades being executed by various trading strategies.
More ...
- 1 of 5
- next ›