Test NanoTrader Full I Test Tradingview I Test the mobile platforms All for CFD-Forex & Futures
You are here
Relative Strength
Relative strength is the ratio of a share price performance to an average market performance. This principle is used in technical analysis. To calculate the relative strength of a stock, the percentage change over a certain period of time is divided by the percentage change of a certain index over the same period of time.
The advantages of the Relative Strength
- You can see the strength or weakness of a security at a glance
- You can compare the strength of different securities
- It is an excellent tool for selecting securities in trend markets
Try a real-time demo of the NanoTrader trading platform
Use and meaning of the relative strength
While the goal of value investors is to buy low and sell high, the goal of strategies based on the principle of relative strength is to buy high and sell even higher. Relative Strength traders therefore assume that the current market trend will continue so that they can achieve a positive return.
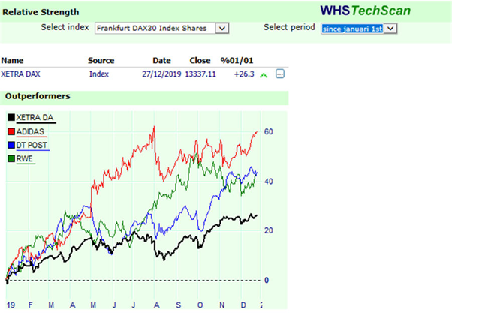
In order to identify possible investment candidates, these investors look at the relative strength of the securities that qualify for such an investment. First, they make an in-depth study of the main benchmark of the eligible securities. This could be the DAX, for example. They try to find out which stocks in this market have outperformed their competitors by either rising faster than their peers or falling less quickly than them. The idea of relative strength assumes that this trend could continue at least for a certain period of time.
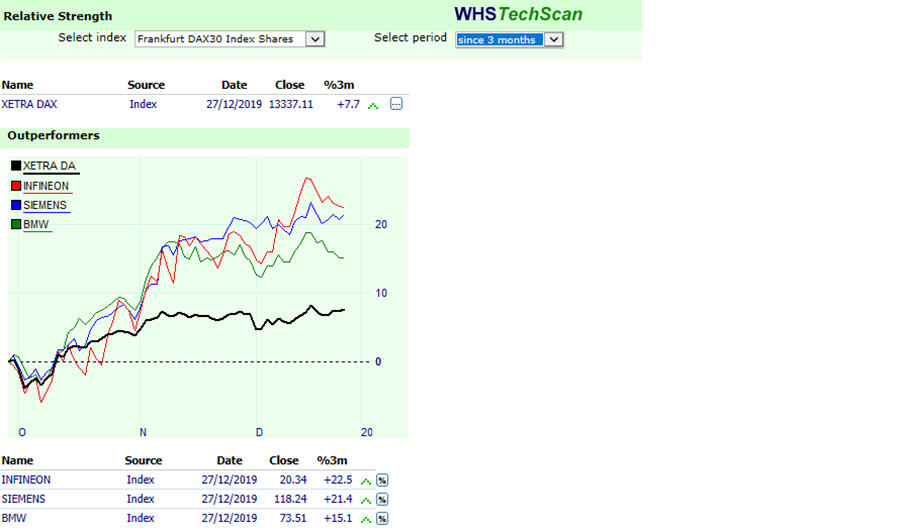

In the example above, the three strongest stocks in the DAX over the last three months are compared with the index. The DAX itself is represented by a black line. It was obvious that the shares of Infineon, Siemens and BMW performed almost twice as well as their index.
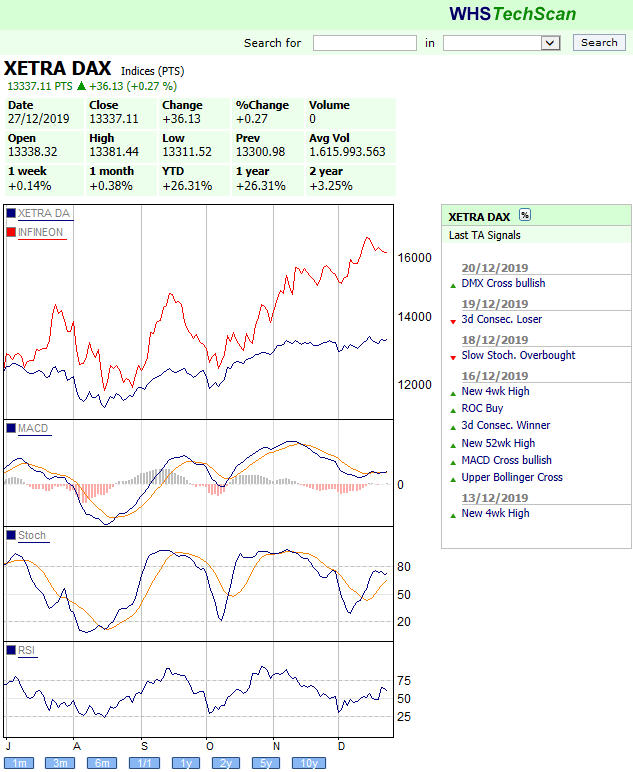
Starting from the basic analysis, the Relative Strength Tool in the WHS Techscan allows the trader to go deeper into the analysis of a single stock. To do so, all the trader has to do is click on the % sign next to the name of the share. This opens the window above, in which the trader can perform a thorough analysis of the Infineon share in comparison to the DAX index.
It is clearly visible that there were times when Infineon clearly correlated with the DAX. This means that the share performed almost as strongly (or as weakly) as the index. However, there were also times during this period when Infineon performed significantly better than the DAX. If a trader recognizes such a phase in time, it makes sense to trade Infineon rather than the index itself.
However, the overperformance of Infineon also led to the share returning above average in times when the index performed less well. In the picture above, this was clearly the case twice. The MACD, Stoch and RSI indicators also seemed to confirm this weakness, which made a short position on Infineon quite interesting.
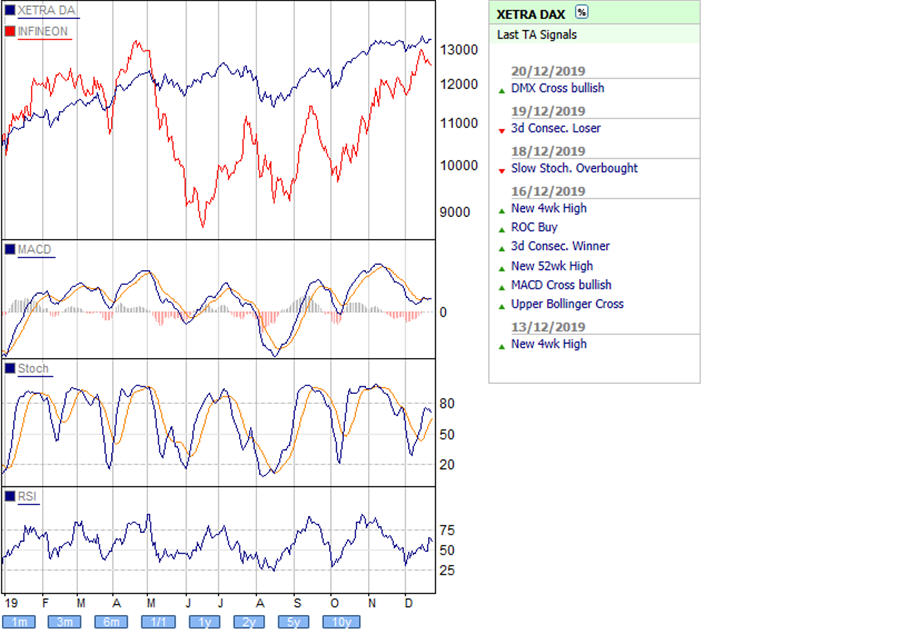
If we now look at the relative strength of Infineon and the DAX for the period of one year, a completely different picture emerges. This shows that Infineon was no outperformer at all for the entire year. In the first quarter, the share still seemed to be able to keep up with the DAX. From the second quarter onwards, a clear underperformance became apparent, which seems to support possible short positions in the event of an index weakness even more. It was not until the last quarter that the share outperformed the DAX, which in turn favoured long positions in Infineon.

Free demo

Trading videos
Charting, strategies, automated trading, backtesting, playback... watch these videos and become a platform master.

Broker
WH SelfInvest serves traders from offices in Germany, France, Switzerland, Belgium, Luxemburg and the Netherlands.
The spectacular SignalRadar
SignalRadar shows live trades being executed by various trading strategies.
More ...
- 1 of 5
- next ›