Test NanoTrader Full I Test Tradingview I Test the mobile platforms All for CFD-Forex & Futures
You are here
The Gartley pattern: a power trading strategy

Easy trading, chart archaeology or ingenious mathematics? At first, you should take a moment and think about the following quote from the obsessive stock market mathematician Max Cohen from the great movie "Pi":
"1. Mathematics is the language of nature. 2. Everything around us can be represented and understood by numbers. 3. If you graphically represent the numbers of any system, patterns emerge. 4. Conclusion: patterns exist everywhere in the world."
Max Cohen is obsessed with finding a formula that will allow him to forecast the price any x stock up to the decimal point. Meanwhile he tries to deal with the number pi, Fibonacci numbers, Kabbalistic Jews and, last but not least, major Wall Street firms that have caught wind of his approaching discovery. It is an ambitious undertaking to be able to predict the entire market - a good movie story, after all - but Max Cohen's basic assumptions can be applied quite practically, as you will see with the Gartley Pattern.
The Garley Pattern power strategy
Garley Patterns and Fibonacci
Let's first examine the following: The Fibonacci number line is one of the most recurring mathematical patterns in nature. It can be found in the spread of swarm populations as well as in the arrangement of the seeds in a sunflower flower. The Fibonacci number series can be described very simply. Each next element is the sum of the previous two: 1, 1, 2, 3, 5, 8, 13, 21, 34, and so on.
However, the far more important aspect of this series is that the fractions formed by two consecutive elements (for example, 13/21) approach the so-called "golden ratio". The golden ratio describes the "harmonious relationship" in which two lengths can be in relation to each other: 1.618:1. The human body has countless of these ratios, for example at the finger joints. But also shells of shells or honeycombs of bees, even galaxies like our Milky Way, are created according to the golden ratio.
The primary interest, however, is in markets and charts. Here, it also possible to observe that there are patterns based on the Golden Section and thus on the Fibonacci number series. This is the reason why Max Cohen follows it in the number "Pi. Fibonacci retracements are a popular tool in technical analysis because through them you can very quickly locate places on charts where a ratio of 1.618:1 has occurred. You should be familiar with this. Less popular is the fact, that on the other hand, there are patterns that are created and operate according to fix defined Fibonacci ratios.
Origin and history
The Gartley Pattern goes back, according to its name, to its discoverer H. M. Gartley, who described its basic structure already in 1935 in his book "Profits in the Stock Market". Together with some other exotic patterns, it is included in the group of harmonic patterns and is considered to be the oldest and best known of them. Harmonic patterns are chart patterns which are composed of a sequence of Fibonacci retracements that are as exact as possible.
It is interesting to note that at the time of Gartley's publication, the concept of retracements was completely unknown and there is no explicit mention of it. As a result, the original ratios in the Gartley Pattern differ slightly from the exact Fibonacci retracements which are used today.
Definition and structure
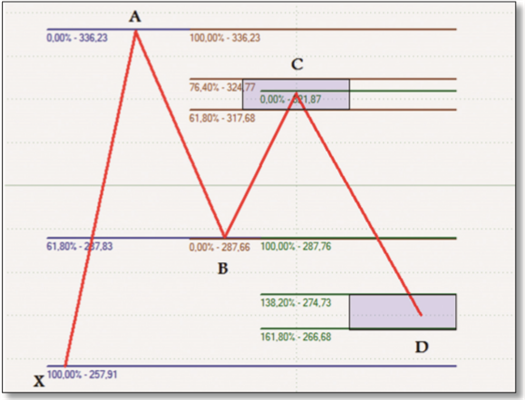
Figure 1 shows a sample of a bullish Gartley Pattern. After any upward movement (XA) leads to a top, the price must first correct as exactly as possible by 61.8 percent (AB, blue). The countermovement initiated after that should again be a correction in the ratio of at least 61.8 percent, maximum 76.4 percent (BC, brown). However, the then following last piece (CD, green) should be at least 161.8 percent larger than the previous one and should close at point D at about 76.4 percent correction of the total height of the pattern (XA). Point D equally describes the entry into a long position. Now all this may seem a little exotic and confused, but you will have no problems with it after a short time and several times of looking at it. The only thing that is needed to create a Gartley Pattern is the correct ratio of price movements and counter-movements. This means, that Gartley Patterns can occur on any chart for any underlying and any time frame, regardless of the current price development or various technical indicators.
Figure 1. Bullish Gartley Pattern. Here you can see the theoretical structure of a Gartley pattern: any given move corrects 61.8 percent, then 61.8 percent again, then 161.8 percent - for a total of about 76.4 percent of the original move.
Simplification and handling
It is a complex and time-consuming undertaking to determine Gartley patterns exactly according to the definitions just mentioned, since there must be created many Fibonacci lines, Gartley patterns are difficult to find and there is still too much room for interpretation. If you strictly follow the definitions, then you may have discovered a nice formation, however, questions arise about where to enter the position, where should the stop be placed, and when a Gartley Pattern is perfect or imperfect. Remember, you are a trader, not an archaeologist! Thus, for a holistic strategic application of the Gartley Pattern, it is essential to resolve these open questions - no matter how gallant the formation is.
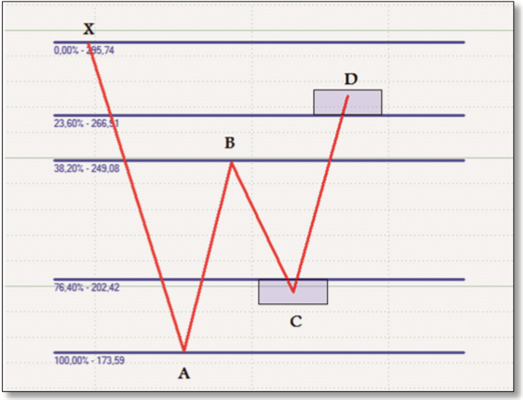
Analogous to the bullish Gartley Pattern, there is a bearish Gartley Pattern, which can be applied exactly the other way round and is aimed at short trades, as shown in Figure 2. You can see that instead of three as in Figure 1, there is only one Fibonacci retracement. Basically, that's enough, too, because once you do the math, the 23.6 percent and 76.4 percent retracements are enough to determine the location of points C and D, respectively. Exactly: X and A define the full 100 percent. B should correct as exactly as possible 61.8 percent, means run to 38.2 percent. If a countermovement with 61.8 percent takes place again at point C, we end up at the original 76.4 percent retracement. Let’s say that 76.4 percent is a golden ratio of second order. Since there is a slight tolerance for the position of point C by definition, the box in Fig. 2 is intended to clarify its possible position. Similarly, point D, which is known to run above the 23.6 percent retracement, is also highlighted as an area.
Figure 2: Bearish Gartley Pattern. Using these Bearish Pattern, it shows that the simplified illustration of the patterns makes the actual trading much easier. Point B is a 61.8 percent correction, points C and D stay in zones around 23.6 percent and 76.4 percent.
Gartley Patterns in Practice
To illustrate these extensive theories, it is worth to look at an practical example. In Figure 3 you will find the daily chart of the British blue chip Tate & Lyle. On this chart you can see a true - bullish - Gartley Pattern. It starts with a conventional upward movement (first circle, 100 percent, point A). From this top, the price corrects almost exactly 61.8 percent (second circle, 38.2 percent, point B). The price turns and breaks through the superior retracement line (third circle, 76.4 percent, point C). However, the high is not reached and the price goes down again. With the push through the 23.6 percent retracement line (fourth circle, point D), the Gartley Pattern is fully formed. The ideal entry point is at 378.45. No strategy without a stop: This is at 363.06 (point X, 0 percent).
Figure 3. example Tate & Lyle, daily chart. This chart shows a bullish Gartley Pattern that has formed almost perfect. The trading system recognizes a clear entry here. Together with stop and target, it is likely to book profit here.
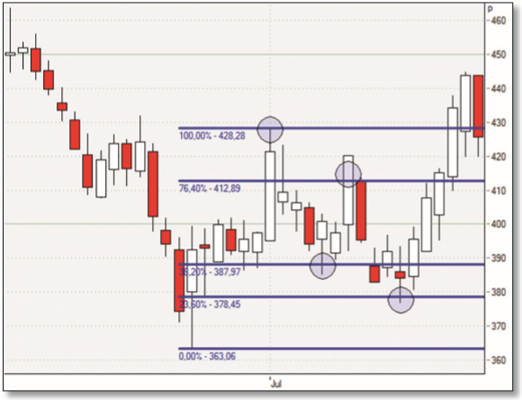
When point A with 428.28 is defined as the price target, this the exit swith a good profit after only five days of holding. In numbers: About 50 points profit at about 15 points risk. This strategy could be extended by targeting a more distant price target or by trading the breakout above point A in a classical way. The profit created by the successfully completed Gartley Pattern could then serve as an excellent risk buffer. As you can see, this is not a completed strategy, but a kind of foundation that can be expanded and systematized as desired. You remember: "Patterns exist everywhere in the world." The task is to recognize them and implement them profitably.
Example 2 - No rush
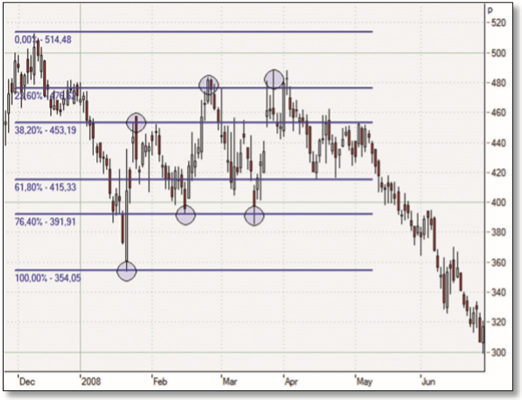
In Figure 4 you can see another example of the Gartley Pattern, this time a bearish one in the chart of Lloyds TSB, another British blue chip from the FTSE Index. If you look at this chart briefly, it will now explain itself to you. After the brilliantly formed first four circles (points A, B, C, D), one could confidently enter short at 476. Interestingly, the C-D movement repeated almost identically. However, this is not a cause to be worried about, but rather to emphasize that patterns of any kind do not always necessarily have to continue exactly once they have been formed. Trading is not an exact science and the markets are always moody.
However, as long as the stop and target with entry are clearly defined, there is no reason to get hectic - because in the end, this Gartley pattern also delivered a good profit. Take a look at where Lloyds TBS stands today!
Figure 4. example Lloyds TSB, daily chart. This bearish Gartley Pattern is at first sight atypical, but with a little patience worked just as well as the one in Figure 3. When the strategy is in place, there is no reason to panic.
Conclusion of the Gartley Pattern strategy
It is not polite to anticipate the end of a movie, but for once an exception must be made for the final illustration of this article.
Max Cohen fails in his attempt, suffers epileptic seizures and finally comes to his senses, the Wall Street firms go away empty-handed and, unfortunately, the traditionalist Jews must also settle for nothing. It is a unrealistic to accurately predict every market movement, no matter how large that set of numbers is and how many patterns might be recognized in it. Nevertheless, the idea of numbers and patterns is quite appropriate, as the Fibonacci parallelism can be seen in nature and in charts.
The Gartley Pattern is an evidence of how profit can be made from single patterns. Unfortunately, however, a freak of nature alone is not enough to make profit; it must incorporate this approach into a holistic strategy. This involves stop setting, target setting and consequent risk-money management.
Remember, you don't have to prove or forecast anything exactly. After all, you are a trader, not a mathematician! Source: Traders' Mag.
People also read
- Detecting chart patterns
- The secret king of chart patterns: The Wolfe Wave
- Define and detect your own candlestick patterns (very cool)
“All you need is one pattern to make a living.”
- trader Linda Raschke
Free demo

Trading videos
Charting, strategies, automated trading, backtesting, playback... watch these videos and become a platform master.

Broker
WH SelfInvest serves traders from offices in Germany, France, Switzerland, Belgium, Luxemburg and the Netherlands.
The spectacular SignalRadar
SignalRadar shows live trades being executed by various trading strategies.
More ...
- ‹ previous
- 2 of 5
- next ›