Test NanoTrader Full I Test Tradingview I Test the mobile platforms All for CFD-Forex & Futures
You are here
The Fibonacci Moving Average Trend Indicator
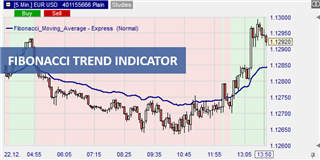
Thanks to its simplicity and accuracy, the moving average is one of the most popular technical indicators in trading. On the other hand, the Fibonacci sequence, known because of the golden ratio, which has proven itself in trading. The Fibonacci Moving Average combines the simplicity of the moving averages with the elegance of the Fibonacci sequence to help the trader identify optimal entry and exit points.
Advantages of the Fibonacci moving average trend indicator:
- easily identifies a developing market
- provides reliable and dynamic support and resistance levels
- practical when trading breakouts
What is the Fibonacci moving average trend indicator?
As the name suggests, the Fibonacci moving average is a technical indicator that combines the exponential moving average (EMA) with the Fibonacci sequence. To understand how the Fibonacci Moving Average works, we first need to break down how each component works.
In mathematics, the Fibonacci sequence is a sequence of integers in which each successive number is the sum of the two preceding numbers. The sequence starts with 0 and then 1. So the first ten numbers in the sequence are 0, 1, 1, 2, 3, 5, 8, 13, 21, and 34. The sequence starts with the second number, and each number in the sequence is the sum of the previous two numbers. For example, 2+1 equals 3, and then 5, 8, 13, 21, and so on to infinity.
The EMA, on the other hand, is a type of moving average used to measure the price performance of an asset over a given period of time. However, with the EMA, more weight is given to recent price changes. This means that the EMA reacts more quickly to price changes and can therefore capture trends more quickly.
The Fibonacci moving average is now calculated using an equally weighted 15-period EMA. In this case, the periods used are the first 15 Fibonacci numbers, starting with 2. Here's how:
- The Fibonacci moving average is derived when the EMA is calculated using these Fibonacci intervals: 2, 3, 5, 8, 13, 21, 34, 55, 89, 144, 233, 377, 610, 987, and 1597
- The sum of each exponential moving average is divided by the period, which is 15
- Finally, draw the Fibonacci moving average on the chart
How does the Fibonacci moving average work?
There are two versions of the Fibonacci Moving Average: the standard and the extended mode.
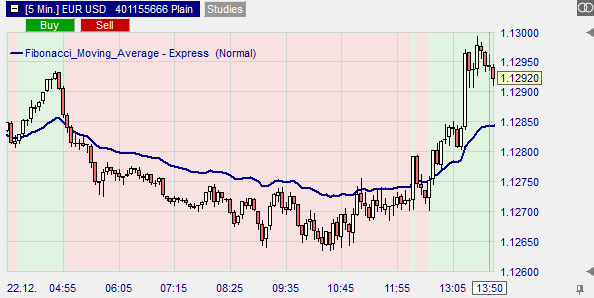
The Standard Fibonacci Moving Average
Opening a trade with the standard FMA is best when the market is trending. It is best to apply the Fibonacci MA as a filter that shows a green or red background on a chart for strong uptrends or downtrends, respectively.
A buy signal is generated when the indicator rises and the price of the asset rises above it. Conversely, a sell signal is triggered when the FMA falls and the price falls below the indicator.
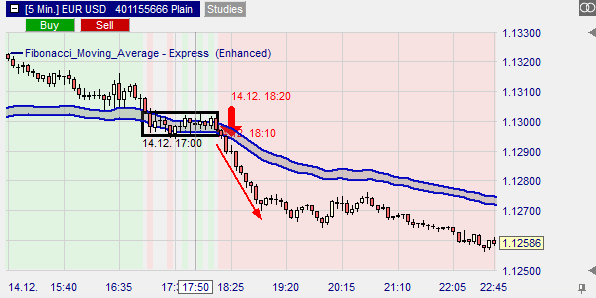
The extended Fibonacci Moving Average
As the name suggests, the extended Fibonacci MA is used to refine entry points by excluding potential false breakouts. For this purpose, the highs and lows of the standard FMA are overlaid, creating a dynamic support and resistance zone. Using this zone, we can assess the validity of a breakout.
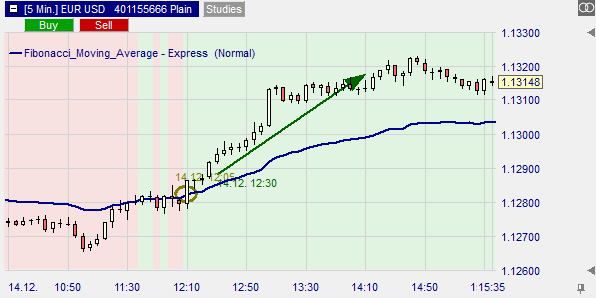
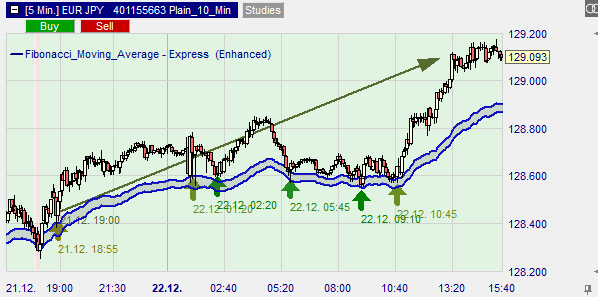
In a trending market, the extended FMA can also indicate areas where a breakout is possible by serving as support in an up market and resistance in a down market. Here is an example of how the extended FMA serves as a support level in an up market.
Conclusion
The Fibonacci Moving Average basically works like the traditional EMA. However, it has been modified to filter out the "market noise", improve responsiveness to price changes and provide reliable and dynamic support and resistance levels.
People also read these trading articles
Free demo

Trading videos
Charting, strategies, automated trading, backtesting, playback... watch these videos and become a platform master.

Broker
WH SelfInvest serves traders from offices in Germany, France, Switzerland, Belgium, Luxemburg and the Netherlands.
The spectacular SignalRadar
SignalRadar shows live trades being executed by various trading strategies.
More ...
- 1 of 5
- next ›