Test NanoTrader Full I Test Tradingview I Test the mobile platforms All for CFD-Forex & Futures
You are here
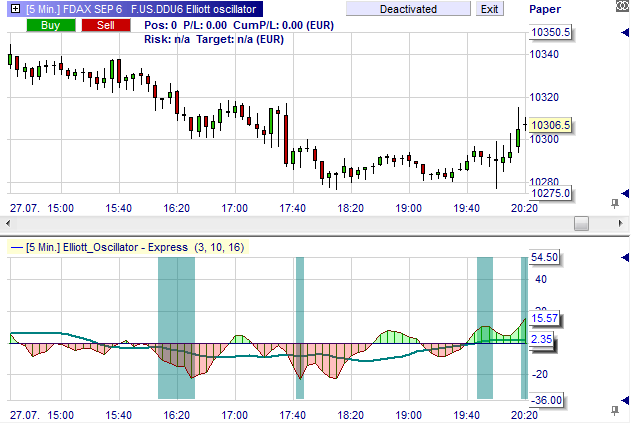
The Elliot Oscillator
This oscillator, which was made popular by Linda Bradford Raschke, identifies the momentum behind market moves and highlights new momentum highs and lows.
The Elliot Oscillator is a 10-period simple moving average subtracted from a 3-period simple moving average and plotted as an histogram above and below the zero line. The result is in addition smoothed by a 16-period simple moving average. This indicator is very similar to the MACD indicator. It can be applied in any time frame (intraday, daily ...).
Free real-time demo of the NanoTrader trading platform used in this article
A special feature of the Elliot Oscillator is that it looks for a consensus of new high / lows in the oscillator and in the price. When there is a new high / low in both the oscillator (20-periods) and the price (40-periods) the background of the is highlighted in blue. This would indicate the most interesting opportunities for traders.
Free demo

Trading videos
Charting, strategies, automated trading, backtesting, playback... watch these videos and become a platform master.

Broker
WH SelfInvest serves traders from offices in Germany, France, Switzerland, Belgium, Luxemburg and the Netherlands.
The spectacular SignalRadar
SignalRadar shows live trades being executed by various trading strategies.
More ...
- 1 of 5
- next ›