Test NanoTrader Full I Test Tradingview I Test the mobile platforms All for CFD-Forex & Futures
You are here
Day trading using moving averages (part 1)
This series of articles focuses on public domain day trading strategies which include moving averages. The objective is not to discuss or compare the different types of moving averages and their respective merits, but to take a closer look at their parameters and how the trader should set these in order to optimise trading results. For day traders and scalpers there are plenty of strategies available, going from a very simple crossover of two or three moving averages to setting a whole range of different moving averages (Rainbow Scalping).
Download a free real-time demo of the NanoTrader Full trading platform
FIBONACCI
When setting up a system based on three moving averages, the day trader and scalper could use a 5-periods, 8-periods and 15-periods simple moving averages (SMA) combination. The concept is based on the famous Fibonacci theory, a theory that reoccurs in many different forms in trading.
Ideally the setup is done in a 5-minute chart, but scalpers could use a faster 1-minute chart. Although the concept is not complicated, it will require the trader some training to correctly interpret the dynamics of the different moving averages. Let’s have a look at some practical examples on the forex pair USD/CHF.
USD/CHF, 5-MINUTE CHART, BUY SIGNAL
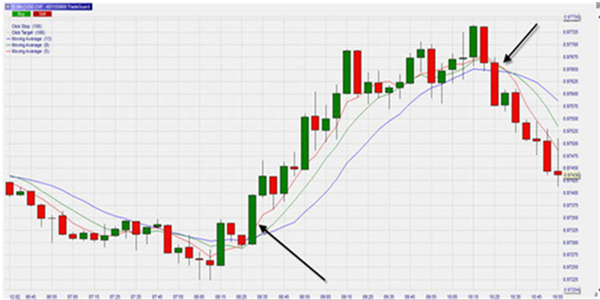
At the start of the day the market is moving sideways and slightly downwards. This is indicated by the three SMA running parallel and pointing downwards.
After 8h00 buyers start to outweigh sellers, resulting in clear bullish green candles crossing all three SMAs (first black arrow). This can be interpreted as a clear buy signal. From this point onwards, the market gains momentum, as indicated by the increasing distance between the different SMAs. Around 10h00 the market’s momentum dies down as indicated by the SMAs moving closer to each other again.
Two exit possibilities present themselves. The trader can close his position when the first candle closes below the 5-period SMA (red) or the 8-period SMA (green). It takes until 10h25 before a first candle closes below the slower 13-period SMA (blue) (second black arrow). At this point all day traders should close out their positions.
USD/CHF, 5-MINUTE CHART, SHORT SELL SIGNAL
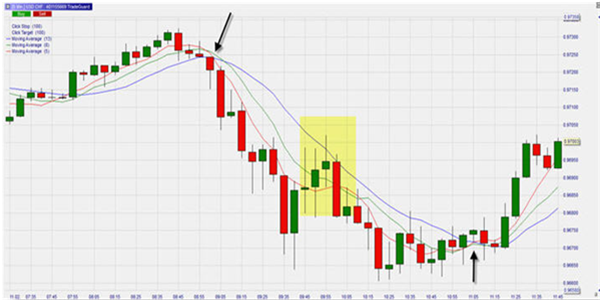
Once again we see the three SMAs running in parallel at the start of the day, indicating a lack of momentum. The situation changes at 9h00 when the market starts to go down. A short sell signal appears (first black arrow) when the first candle closes above the three SMAs. Within 30 minutes the market has dropped significantly and the short position is showing a profit.
At around 9h45 the situation changes when the market changes direction. This rebound lasts for about 15 minutes as indicated by the yellow zone in the chart. Some traders may want to close their position when the candle closes above the 5-period SMA (red) or the 8-period SMA (green). Other traders would keep the position open until around 11h05 (second black arrow) when the first candle closes above the slower 13-period SMA (blue).
Download a free real-time demo of the NanoTrader Full trading platform
Free demo

Trading videos
Charting, strategies, automated trading, backtesting, playback... watch these videos and become a platform master.

Broker
WH SelfInvest serves traders from offices in Germany, France, Switzerland, Belgium, Luxemburg and the Netherlands.
The spectacular SignalRadar
SignalRadar shows live trades being executed by various trading strategies.
More ...
- 1 of 5
- next ›