Test NanoTrader Full I Test Tradingview I Test the mobile platforms All for CFD-Forex & Futures
You are here
The Commitments of Traders Report (CoT) Part 2
This second part of the article on the CoT report details the use of the report and also talks about the disadvantages. Some examples with charts illustrate the use of the report and the CoT index. Read also Commitment of Traders Report (CoT Report) Part 1
Use of the CoT Report
The CoT report can now provide crucial insights into the positions of the various market participants. However, since the sum of the positions must always add up to zero, the question arises as to which of the three participants should be considered more closely. Here, a common approach is to follow the "smart money" or at least to avoid trading positions contrary to the positions of the smart money. The prevailing opinion is that the smart money is the commercials. Here one is dealing with professionals in the respective asset class who have a high purchasing power. If, for example, a company that needs large quantities of sugar for production hedges conspicuously intensively against falling prices, it is likely that this company will assume that prices will fall. The following is an example of this.
The Commercials as an indicator for trend changes
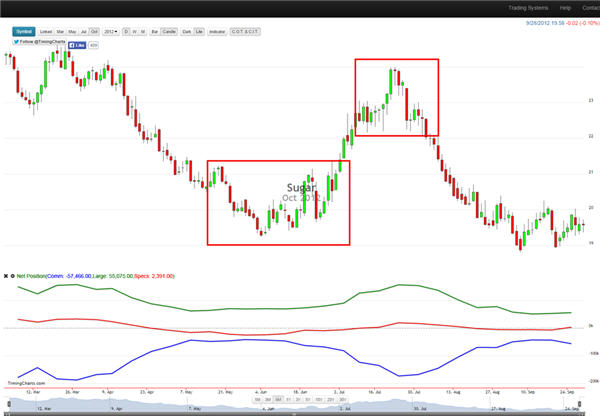
A common example of incorporating the CoT report into one's own forecasts is to take into account the net positions of the commercials (shown as a blue line below the price trend). The following example shows a sugar future, below which is the course of the net positions of the three market participants. The trained eye immediately recognises that the positions must add up to zero and thus the curves always run reciprocally. As a rule, non-commercials and non-reportables take the counter-positions of the commercials.
The approach now is to identify large changes in the hedging positions of the commercials, derive trading tactics from them and enrich them with other methods such as technical analysis. In sugar futures, for example, we can see that the commercials' short positions were drastically reduced from May 2012 to the end of June 2012 (even though on balance there was still a small short position). At the same time, open interest also decreased (all three lines are approaching zero). This is an indication that the previous downward movement is very likely to come to an end and lead into a sideways market. An early sign of an imminent countermovement.
The development of the net positions of the commercials is also suitable for exiting: From the beginning of July, the sell positions of the commercials increased again. The probability of a countermovement is thus at least higher and own existing positions can be reduced or closed out if necessary.
The CoT Index
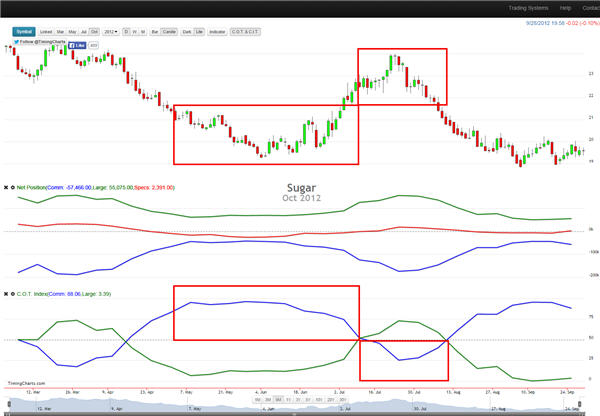
The CoT index is also particularly popular for use in trading. This puts the respective net positions of the three market participants in relation to the high or low of a (self-selected) previous period. This creates an oscillator that fluctuates between two extreme ranges and around a zero line.
Here the change in holdings, which was discussed in the previous chart, becomes even clearer. The first two red boxes show a large reduction in short positions (below) and the corresponding price trend (above). The second red boxes show how the zero line was crossed and sell positions were increasingly built up again (below) and how the price trend forms a top in this area (above). Again, this information can be used as an indicator in your own trading
Ultimately, there is no single pattern or clear guidance on how to use the CoT Report or the CoT Index derived from it, and the examples above are only some of the possibilities. Ultimately, every market ticks differently. In principle, however, it is worthwhile, especially for medium to long-term investors, to examine the individual underlyings closely with regard to the positioning of important market participants in order to be able to recognise major shifts.
The extended CoT Report since 2009
Since 2009, the previous report has been supplemented by an extended CoT Report, which covers 22 commodity markets and adds transparency on the positions of market players. The different participants and the relation to the previous report is listed here:
- Producer, Merchant, Processor, User (Commercials)
- Swap Dealer (Commercials)
- Money Manager (Non-Commercials)
- Other Reportables (Non-Commercials)
- Non-Reportable (Non-Commercials)
Disadvantages of the CoT report
Due to the characteristics of the report, some disadvantages can be derived which should at least be taken into account.
Only forward contracts. As mentioned, the CoT Report only refers to forward transactions (options and futures) and cannot be applied to individual shares, for example, or only very indirectly. In the area of currencies, commodities or indices, however, the CoT report is definitely useful information.
US reference. A critical point is that the CoT Report refers exclusively to futures contracts traded in the USA and thus only accounts for a fraction of the total positions. Nevertheless, the report can certainly serve as an indicator.
Weekly publication. Another disadvantage is that the data are only published weekly. Thus, the report is mainly suitable for long-term and medium-term investors. Day traders will at best be able to use the report as an indicator of the institutional sentiment.
People also read
The Commitments of Traders Report (CoT) Part 1
Volume profile and key price levels
If you are interested in a good managed account, check out this service
Recommended broker
Free demo

Trading videos
Charting, strategies, automated trading, backtesting, playback... watch these videos and become a platform master.

Broker
WH SelfInvest serves traders from offices in Germany, France, Switzerland, Belgium, Luxemburg and the Netherlands.
The spectacular SignalRadar
SignalRadar shows live trades being executed by various trading strategies.
More ...
- ‹ previous
- 2 of 5
- next ›