Test NanoTrader Full I Test Tradingview I Test the mobile platforms All for CFD-Forex & Futures
You are here
Beating the market index with the Rainbow indicator
On paper at least, the Rainbow indicator would have beaten a direct investment in the DAX. Traders still looking for trend orientation in a chaotic stock market chaos might have found it in the Rainbow.
Follow the Rainbow - Beat the market
For a while now the Rainbow indicator has enjoyed great popularity. The Rainbow can be used as a trend-following indicator in order to take a position in a trend that is just starting or is already underway. It is only used for taking long positions.
Figure 1 shows the Rainbow indicator in the Dax daily chart.
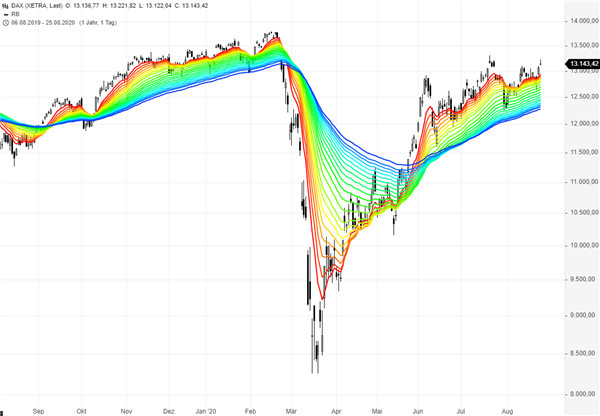
When you look at the chart, it is clear how this indicator got its name. With its many moving averages it shows at a glance in which direction small, medium or even larger trends are going.
What can the Rainbow indicator (not) do?
- A previous position must be closed and the signal finished, before another position is opened.
- Yesterday's closing price must be below the highest average.
- Today's closing price must be above the exit Rainbow (see below).
- Today's closing price must be above the highest Rainbow average
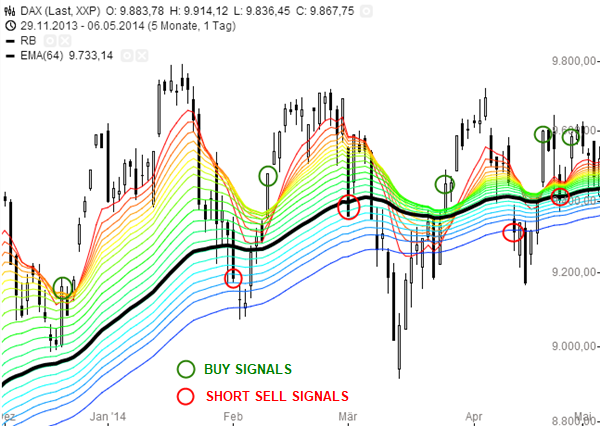
Put simply, if the price leaves the top of the rainbow zone and rules 1-4 are fulfilled, a long position can be opened tomorrow, at the start of trading. The position is held until the daily closing price drops below the exit rainbow. In the following example, an EMA (64) is used for this. Potential entry and exit signals are indicated in the chart.
Testing the Rainbow indicator
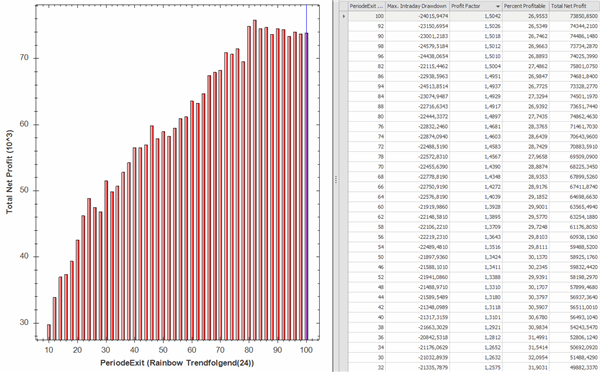
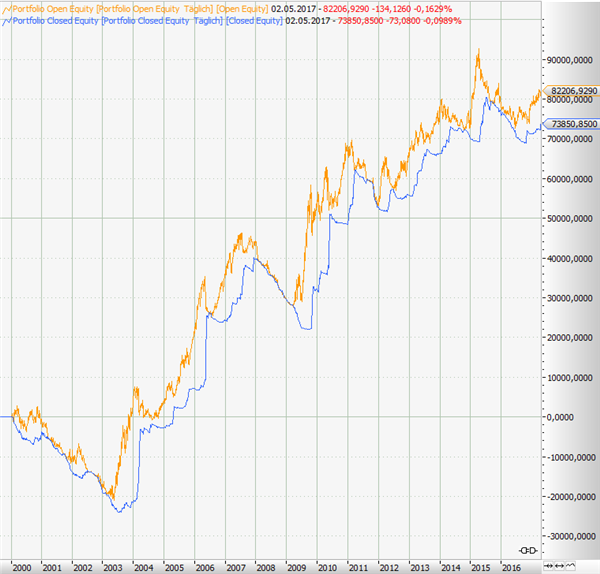
Let's use the Rainbow indicator as is, in its basic setting, but let's add a variable exit exponential moving average. We want to use this variable average to explore different time frames and their performance. The Rainbow is used here in stock trading (note: dividend payments are completely disregarded, which means that the result is underestimated, especially in the dividend-rich Dax). Figure 3 shows the summary statistics depending on which exit average was used. The performance curve in Figure 4 reflects the portfolio performance for the setting of 100 periods at the exit EMA.
Conclusion
The Rainbow Indicator is certainly not a miracle weapon, but it can give the trader support in an otherwise chaotic stock market environment. Since it is traded exclusively on the long side, the approach naturally has its problems in the context of prolonged bear markets. If you compare the performance with the interim drawdowns, the approach still has its appeal. The Rainvow had a maximum drawdown of 20 000 but ended up with a profit more than three times this amount. The German DAX index had a much worse risk-reward profile in the comparison period. Over the same period the DAX had a much higher draw done and only doubled in value. The Rainbow indicator beat the DAX index.
The question remains whether it makes sense to trade this approach systematically and by itself. We're not sure. Alternatively, this systematic approach can be used as a filter for other trading strategies.
Recommended broker
People also read
Are you interested in a good managed account? Check out this regulated service:
"The elements of good trading are (1) cutting losses, (2) cutting losses, and (3) cutting losses. If you can follow these three rules, you may have a chance."
- trader Ed Seykota
Free demo

Trading videos
Charting, strategies, automated trading, backtesting, playback... watch these videos and become a platform master.

Broker
WH SelfInvest serves traders from offices in Germany, France, Switzerland, Belgium, Luxemburg and the Netherlands.
The spectacular SignalRadar
SignalRadar shows live trades being executed by various trading strategies.
More ...
- ‹ previous
- 2 of 5
- next ›