Test NanoTrader Full I Test Tradingview I Test the mobile platforms All for CFD-Forex & Futures
You are here
ATR level. Using the Average True Range

The Average True Range is a practical tool for drawing lines in order to obtain better orientation in intraday forex charts. The ATR is based on classic averages. In this article, we want to take a look at this unusual indicator which, in combination with the pivot lines, will provide you with a useful tool to get a clear view of forex markets.
Anyone who starts chart analysis for the first time will first be overwhelmed by the high number and wide variety of instruments on offer. Years can pass before a newcomer becomes an experienced stock market player. They practice, mistakes are made, mistakes are improved - and all this costs money. The numerous books which are read along the way provide a lot of information. But nevertheless, they’re only theory. All that counts on the stock exchange is practical experience. This is, of course, also the case for the Average True Range, which we will first explain to you and then combine with pivot lines. Clearly, we can't give you experience, but maybe we can help to shorten a little the long road toward becoming an experienced stock market player...
The Origins: The Commodity Market
At first glance, the Average True Range indicator is neither suitable for generating signals nor for confirming a specific direction of the market. It takes a second look to see the value of this extraordinary tool.
The ATR was developed due to the extraordinary price movements in the commodity markets in the seventies. Like the pivot lines, it also gives an indication of the current market situation. Basically, it is a tool for estimating current volatility and can therefore also be used for risk control.
The average true range is the moving average of the true range indicator developed by J. Welles Wilder in 1978. It was originally intended to take into account the "limit" movements on the commodities markets. But what are "limit" movements? These are days on which no trade takes place because of a large price jump. The background: commodities traded on the commodity exchange may only make a certain maximum movement upwards (limit-up) or downwards (limit-down) per day. If this is exceeded, trading is suspended until the next day.
Trading is resumed on the following day. If a limit movement occurs again, there are no volumes on that day. Let’s take an example on wheat.
On this type of commodity, a storm can cause the loss of a large part of the annual harvest. In this case, the market would open overnight with an upward limit, possibly even several days at a time. If this happens, there is neither a high nor a low price, but only one price per day. The volatility, i.e. the intensity of price fluctuations, is therefore extremely high in such a scenario, and traders are sometimes trapped in their positions for days on end.
About the broker WH SelfInvest:
“ You have to give them credit for one thing, the client support (also for "potential clients") is indeed very convincing, as is often mentioned in forums. “- Ethan
Basics
To reflect this increased volatility, Wilder looked for a way to capture these movements. The traditional volatility formula, which calculates daily highs and lows, would show incorrect results in this case because it does not take into account the price gaps that exist between the days, and with only one price fixed, no calculation was possible anyway. Wilder went a different way and found the True Range to calculate realistic values in all scenarios.
Calculation of the ATR
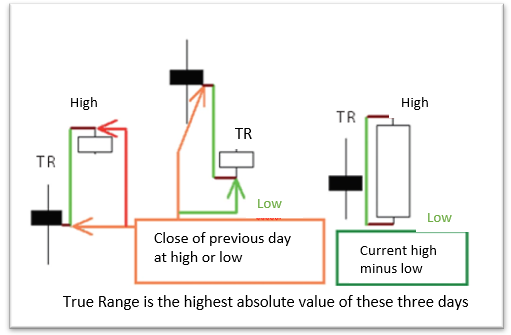
So how exactly are the True Range and the ATR indicator calculated? Here is an example: let's assume that a trading instrument closed at 50.00 points the day before. Today you record the following prices: High 53.00; low 50.50; closing price 52.50 points. Now the three following calculations are made.
- Current high (53.00) - current low (50.50) = 2.5
- Current high (53.00) - Closing date the day before (50.00) = 3.00
- Current low (50.50) - Closing date of previous day (50.00) = 0.50
The True Range is the highest value of these three calculations, in this case 3.00. With negative numbers, the sign is simply omitted, the highest number is always the result. In Figure 1, you can reproduce the three calculation formulas with a candlestick chart. An average of these values is calculated to obtain the ATR indicator (Average True Range). This moving average is now used with the ATR levels to calculate further resistance and support lines in the intraday range (in addition to those already specified by the pivot lines).
Figure 1: calculation of the Average True Range.
Average True Range - the indicator
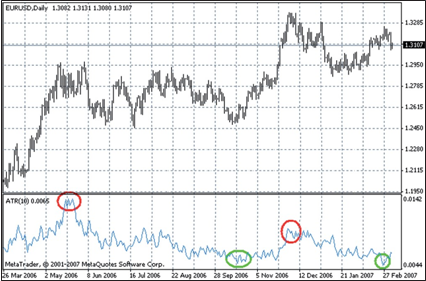
Before we turn to these ATR levels, let us first take a look at the normal application of the ATR indicator. Figure 2 in the lower part of the chart shows the normal ATR indicator. In this day chart of the Euro you can see that the indicator usually displays low levels before the beginning of a larger movement, high values are usually reached just before the end of a large movement. Of course, this also raises the question of what is actually high or low, and therefore this indicator can only be used as an aid. I can give good hints, especially intraday. This is particularly true when placing stops (if the ATR indicates an average movement of 5 ticks per hour, the stop should be larger than these 5 ticks to avoid random stopping). It can also help to detect possible support and resistance lines.
About the broker WH SelfInvest...
"For me and some of my neighbours, this was the best presentation we had ever heard on trading systems, indicators, etc." - W.X.
Construction of ATR levels
These intraday lines are calculated using an indicator developed by Russian trader Mike Ischenko. He called this indicator the ATR level. Similar to pivot lines, they are drawn in the charts as support and resistance lines. But as mentioned earlier, one indicator alone is not very effective. For example, if you combine the ATR levels with the pivot lines, some lines are even doubly meaningful.
Figure 2: Calculation of the True Range. The EUR/USD in a daily chart and the corresponding ATR indicator. High levels indicate the end of a movement, low levels a beginning. These levels do not indicate market direction.
Example: 15-Minute chart
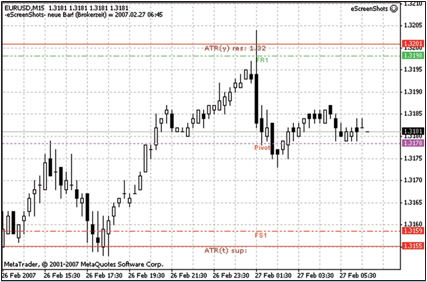
In figure 3 you can see that at the upper resistance 1 (dotted line) of the pivot-indicator is near the ATR-resistance (solid line). The same is true below at the level of pivot support 1, which is also close to the ATR level. If these lines are broken, the price often traces through to the next line. When testing these lines for the first time, counter-movements often occur, as can be seen in Figure 3 from both resistance lines. Pivot lines and ATR levels are not always at the same level, they can diverge considerably. In practical forex trading, you should look at this type of chart during the day, preferably without drawing any more lines. If the price is below the pivot on a support line, look for buy signals. If the price is around the pivot, it is best to wait and observe the price further. If the value is at the resistance, look for short signals. Source: Traders Magazine.
ATRs and Pivots in Economic Data. With new economic figures only extreme ATR levels serve as possible support and resistance lines. Once broken, the former support becomes a resistance.
Figure 3. ATR-Levels and Pivot lines. The combination of the ATR levels with the pivot lines often shows that the lines coincide.
Example: Economic figures
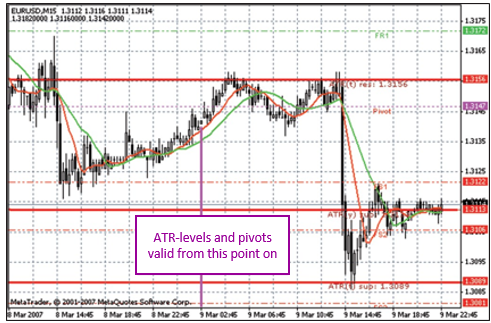
Another example of the use of ATR levels and pivot lines can be seen in Figure 4. The chart shows the price of the Euro in US dollars on March 9, 2007. This day was not a normal trading day, as labour market data for the United States was published at 2.30 pm. Such dates are always good for surprises in the markets.
After the announcement of such figures, there are often very strong reactions in one direction or the other and the markets become very volatile. Even sophisticated trading systems have problems in such situations. Experienced market participants advise against being positioned in such an environment at all. Many market participants are caught on the wrong foot, stopped out and all sorts of indicators show erroneous signals. It is therefore best to wait and act only when things have settled down.
On the left, the vertical bar indicates the point in time from which these lines apply. The thick horizontal lines are the ATR levels of the day. After the beginning of the day, the Euro rose above the pivot to the first ATR-resistance at 1.3156 points.
After this test one the price drops to the pivot and rises again to the ATR-level, the resistance at 1.3156 at 2:31 pm. This is when employment data is released in the USA. At that moment, the US dollar becomes stronger and begins to rise against the euro. You can see how massively the Euro drops in just one bar. The first ATR support as well as the pivot support there are both broken. The downward movement then stops suddenly at the second ATR level support. The line is tested twice and there is a counter-movement of 30 pips. What do you think will happen now? The former support at the ATR level becomes resistance. The Euro holds at the inner ATR level and oscillates there until the end of trading.
Figure 4: ATR levels and pivots in Economic Data.With new economic data only extreme ATR levels serve as possible support and resistance. Once broken, a support becomes a resistance.
Do not only watch indicators when data is published
These correlations clearly indicate that simple indicators and trend lines are not enough. You should always first observe the price trend with the help of pivots and ATR levels before trading. When large movements occur, especially after the release of important economic data, one can assume that most indicators will not work and will give false signals. There are very often strong swings with violent counter-movements. Because such movements can occur relatively frequently in the forex markets, pivot lines and ATR levels can be very helpful.

Free demo

Trading videos
Charting, strategies, automated trading, backtesting, playback... watch these videos and become a platform master.

Broker
WH SelfInvest serves traders from offices in Germany, France, Switzerland, Belgium, Luxemburg and the Netherlands.
The spectacular SignalRadar
SignalRadar shows live trades being executed by various trading strategies.
More ...
- 1 of 5
- next ›