Test NanoTrader Full I Test Tradingview I Test the mobile platforms All for CFD-Forex & Futures
You are here
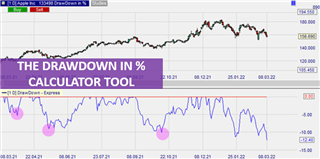
The Drawdown Trading Tool

Risk management is the cornerstone of any successful trading strategy. No trading strategy is 100% accurate, which makes risk management all the more important. But before you implement it, you first need to know what the potential risk of each asset is. This is where the percentage drawdown comes into play.
Advantages of the Drawdown Trading Tool in NanoTrader:
- It allows traders to see the minimum and maximum drawdown at a glance
- Traders can immediately get an idea of the potential losses of an asset
- Traders can easily compare the risks of different assets and support portfolio diversification
- Helps compare potential losses over different time periods
What is the percentage drawdown?
Drawdown represents the lowest price an asset reaches between its two highest prices. It basically measures the loss in value of an asset or trading account after a high before the high is reached again. Usually, the drawdown for a trading system is expressed in dollars or, more commonly, as a percentage.
The drawdown is calculated as follows:
Drawdown (DD) % = {(Max. price - Min. price) / Max. Price)} * 100
In this case the Max. Price = Historical High (Peak)
Min. price = historical low (trough)

Note that drawdown does not represent a loss. It is only a temporary decrease in the price of an asset, while a loss represents the entry price compared to the exit price. This means that drawdowns represent historical volatility. In a broader sense, this helps the trader allocate funds to their trades to ensure that they are not closed prematurely before the asset recovers.
How to use the Drawdown Trading Tool in NanoTrader
It is important to emphasize that the drawdown in NanoTrader is not used to generate trading signals. The percentage drawdown measures the financial risk associated with a trade.
Determination of the risk in different time frames
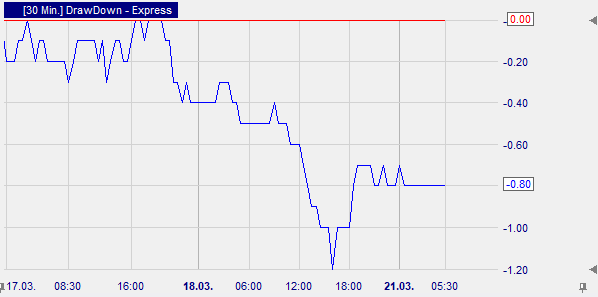
As mentioned above, drawdown is calculated based on historical data. Depending on the time frame you trade, you can determine your risk by measuring volatility over different time frames. With the Drawdown Tool, you can easily determine the worst case trading results over time.
The maximum drawdown of an asset should also help you determine the percentage of your capital that you invest in a particular trade. Here are a few examples.
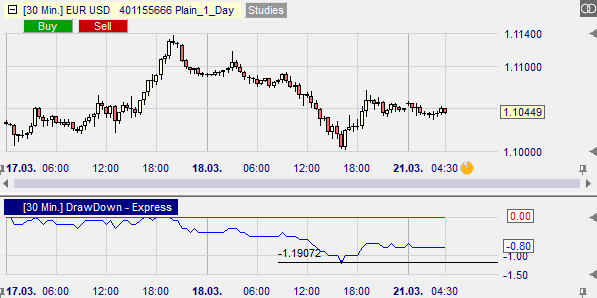
Below you can see a 30-minute chart of the EUR/USD, which shows a maximum drawdown of 1.19%. This means that a day trader can anticipate this level of risk and adjust his capital allocation accordingly.

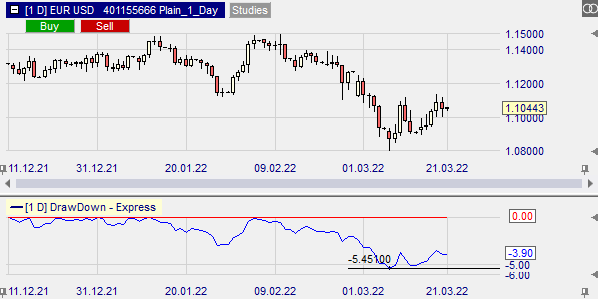
Let's now look at a larger time frame. The chart below shows the EUR/USD in a daily time frame with a maximum drawdown of 5.45% that a longer-term trader can expect.

Determination of an appropriate Stop-Loss
By definition, a drawdown is a measure of downside volatility. It helps the trader understand how much financial damage his system can take and determine when to exit the market. This means that drawdowns are ideal for determining optimal stop loss levels. This helps to psychologically prepare the trader to avoid panic exits and take unnecessary losses.
Let's stick with the above examples. The short-term trader can expect the asset price to fall 1.19% before recovering, while the longer-term trader can expect up to 5.45%. These are worst case scenarios. However, if the price falls more than the maximum drawdown, the losses may accumulate further than the trader would like financially. Therefore, the trader should set the stop loss just below the maximum drawdown.
Conclusion
The "The Drawdown" Tool in NanoTrader helps the trader to instantly visualize the drawdown of any asset on any time frame. Normally, traders had to perform tedious backtests to determine the maximum drawdown and its duration. And although the drawdown tool does not provide trading signals, it is indispensable when it comes to determining potential risks and helping the trader set stop loss levels.
Drawdowns are important to measure the historical risk of various investments, or to monitor personal trading performance.


