Test NanoTrader Full I Test Tradingview I Test the mobile platforms All for CFD-Forex & Futures
You are here
Volume profile... key price levels
The observation of volume profiles and time price opportunities is part of the tools of the trade of every professional retailer. The Volume Profile represents the traded volume of specific price levels. The Volume Profile thus provides a deeper insight into the current positioning of market participants. This concept can only be used in futures trading with high-quality tick-by-tick data.
Time Price Opportunities are a constantly evolving graph that organizes market data based on the Auction Market Theory. They compare the price (the variable) on the vertical axis with the time (the constant) on the horizontal axis to create a distribution over the selected time period. This concept allows time price opportunities to be applied to both futures traders and CFD forex traders.
"The volume profile and volume trading tools in NanoTrader are excellent. And, as usual, NanoTrader goes further than any other trading platform by offering unique tools such as the Volume Viewer." - Roland
The advantages of Volume Profiles and Time Price Opportunities
- Important price levels are automatically plotted.
- Allow traders to better time entries and intelligently place stops.
- The indicators can be used in any time unit for both day trading and swing trading.
- The indicators can be used in trend phases as well as in sideways phases.
- No programming knowledge required.
The examination of VWAP and Volume Profiles belong to the tools of the trade of every professional dealer. The VWAP is similar to the moving average, but takes into account the traded volume in particular. The indicator is extended by the standard deviations, which make it possible to define support and resistance in different time units. The Volume Profile represents the traded volume of specific price levels. The Volume Profile thus provides a deeper insight into the current positioning of market participants. These concepts are used in particular by day traders in futures trading. Look forward to an hour of expertise and live analysis.
Identify every key price level
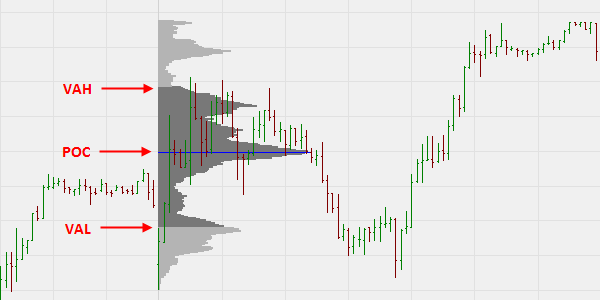
The Volume Profile (also known as the Market Profile) shows the activity of the market at certain price levels. It shows the price distribution per selected time period. The Volume Profile visualizes the following significant areas:
- Point of Control (POC or VPOC): The price level with the highest traded volume in the selected period.
- Value Area (VA): The range of price levels in which a certain percentage of the total volume was traded during the selected period. Usually this percentage is set to 70%.
- Value Area High (VAH): The highest price level within the Value Area.
- Value Area Low (VAL): The lowest price level within the Value Area.
Every key price point and area is visible in the chart.

Use the Volume Profile when trading
The Volume Profile can be used by traders in many different ways. This tool is more than a simple technical indicator. It is a decision-making tool used in daily trading. The Volume Profile puts the current market situation into an easy to interpret chart context.
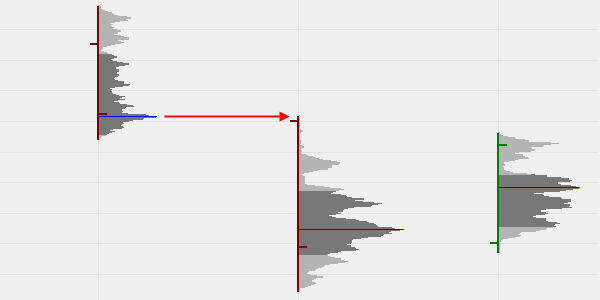
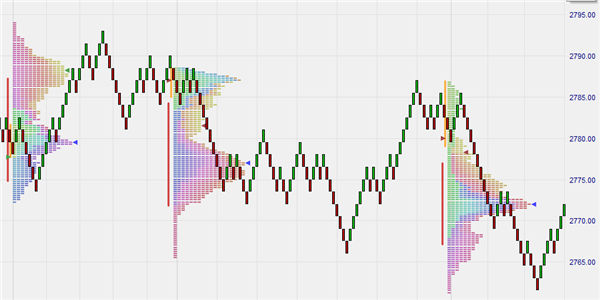
One simple application is to use the key points and areas of the previous day's Volume Profile as support/resistance. In the following example, the market opened within the previous day's Value Area, tested the previous day's VPOC, and then continued its downward movement. The return to the previous day's VPOC was therefore a possible sell option.
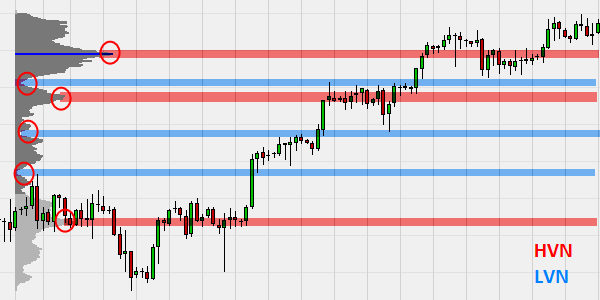
High- and low-volume nodes are also of interest to many traders.
- High Volume Nodes (HVN): High Volume Nodes are areas where a high order volume was traded at or around one price level. These spikes can be used as indicators of consolidation and agreement.
- Low Volume Nodes (LVN): Low Volume Nodes are areas where a low order volume was traded at or around one price level. These low points represent an area of indecision and disagreement. Usually the market does not stay at this price level for long.
In this example the HVN are indicated by the red extensions and the LVN by the blue extensions.
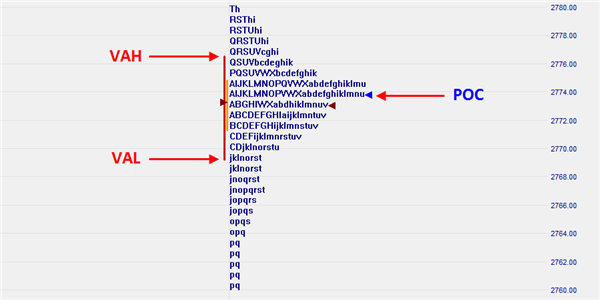
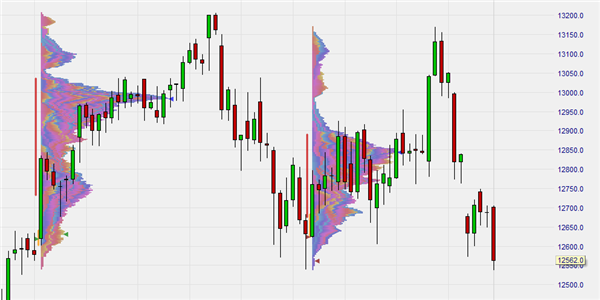
Time Price Opportunities (TPO)
TPO are constantly evolving graphs which organize market data based on Auction Market Theory. You compare the price (the variable) on the vertical axis with the time (the constant) on the horizontal axis to create a distribution over the selected time period. Time Price Opportunities can be displayed both in the main chart and in a subwindow. Typically, a value of 30 minutes per TPO box is used to create the distribution. Unlike Volume Profiles, Time Price Opportunities can also be used in markets where no representative volume is available, such as CFD-Forex trading.
Time Price Opportunities visualizes the following significant elements:
- Point of Control (POC): The price level at which most TPO boxes occurred in the selected period.
- Value Area (VA): The range of price levels in which a certain percentage of TPOs occurred during the selected period. Usually this percentage is set to 70%.
- Value Area High (VAH): The highest price level within the Value Area.
- Value Area Low (VAL): The lowest price level within the Value Area.
This example shows the compressed view, which is the usual form of this type of price display.
Time Price Opportunities graphically process complex information in order to be able to view the market as a whole from the meta level. In principle, the same trading setups can be used as those based on Volume Profiles.
Tip: Time Price Opportunities can also be used on non-time-based charts (i.e. movement-only charts such as Renko charts, range bars and WL bars).
The following example shows a Renko chart with TPOs on a daily basis.
Time Price Opportunities can also be used in higher time frames. The following example shows the monthly TPO profile in the DAX future.
The astonishing volume viewer
The Volume Viewer is a unique tool for volume traders. It only exists in the NanoTrader trading platform. Go to the Volume Viewer section.
People also read
VWAP and TWAP, a basis for trading strategies
The sensational Volume Viewer for futures
Are you interested in a good managed account? Check out this qualified service...
Free demo

Trading videos
Charting, strategies, automated trading, backtesting, playback... watch these videos and become a platform master.

Broker
WH SelfInvest serves traders from offices in Germany, France, Switzerland, Belgium, Luxemburg and the Netherlands.
The spectacular SignalRadar
SignalRadar shows live trades being executed by various trading strategies.
More ...
- 1 of 5
- next ›